XRP Tests Support After ETF Launch Fails to Sustain Rally
Market Pulse
- XRP is consolidating its recovery gains in a familiar range above $2.28.
- The price travels higher after the recent breakout saw the cryptocurrency surpass the key resistance of $2.31.
- The token’s overall demand picture is underpinned by renewed interest induced by the Ethereum ETF.
Furthermore, Ripple’s native coin consolidation above the overhead resistance validates it as crucial support.

XRP is currently trading at $2.28, down 5.65% on the month. The launch of the first U.S. spot XRP ETF on Nasdaq saw $58M trade on launch day. While this new listing did drive some buying demand above, bulls stalled just shy of December highs at $2.70. A measured retracement has followed, with XRP shedding $0.42 off the high. For those speculating on price, the real question is whether the newfound institutional access will be enough to underpin recent buying, or if those in weak long positions may be forced to exit leaving price to search for lower support.
| Metric | Value |
|---|---|
| Asset | XRP (XRP) |
| Current Price | $2.28 |
| Weekly Performance | -1.64% |
| Monthly Performance | -5.65% |
| RSI (Relative Strength Index) | 43.1 |
| ADX (Average Directional Index) | 36.9 |
| MACD (MACD Level) | -0.07 |
| CCI (Commodity Channel Index, 20-period) | -77.33 |
RSI Drops to 44.5 – First Neutral Reading Since ETF Rally Kicked Off
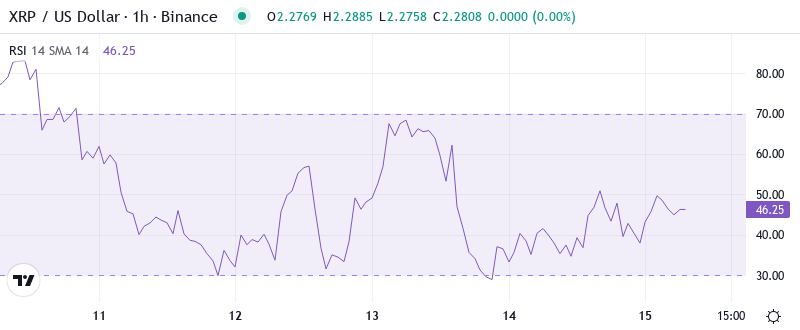
With the Relative Strength Index (RSI) oscillator reading at 44.5, traders will notice that momentum has reset entirely from the overbought levels above 70 seen at December’s peak. This cooling phase marks the first time RSI has reached neutral ground since ETF speculation began heating up in early December. In fact, RSI dropped to similar levels in September before XRP moved higher from $0.50 to $0.74.
For swing traders, this flat RSI means accumulation opportunities are once again available without the chase risk that was present two weeks ago. The ETF’s successful launch and $58M opening volume would imply institutional interest remains in check, but the fact is the market needed this momentum reset in order to digest the 194% annual gains.
What is most telling about the RSI is that it held above the 40 floor during the pullback, tipping its hat to the bulls as they maintained their ground while prices cooled off of frothy levels.
ADX at 36.9 Confirms Strong Trending Conditions Despite Pullback
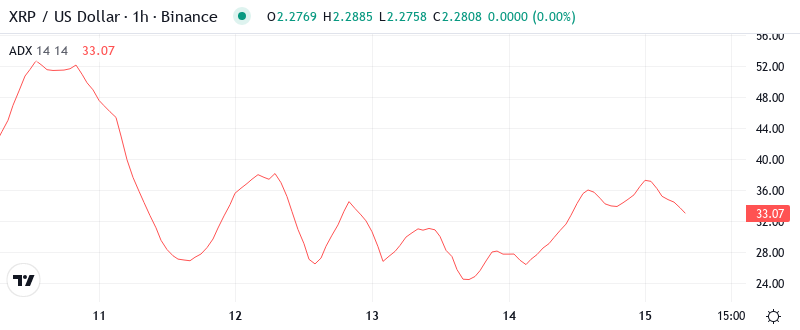
The ADX has increased to 36.9, which shows that the recent rally and subsequent pullback have had strong momentum. This value indicates that it’s a trading market rather than a choppy one. The ADX is above the key level of 25 that gives trend followers an advantage, so the uptrend remains in place despite some selling.
In simple terms, the high ADX indicates that the pullback is not a full turnaround but a correction as part of a larger upward trend. For day traders, this means adjusting to a trending environment by buying the pullbacks to support and selling the rallies to resistance, instead of countering each move. The underlying ETF mechanism ensures the necessary fundamentals for a trend to take place, as it takes time for institutional investors to make their investments.
50-Day EMA at $2.52 Flips From Support to First Major Resistance
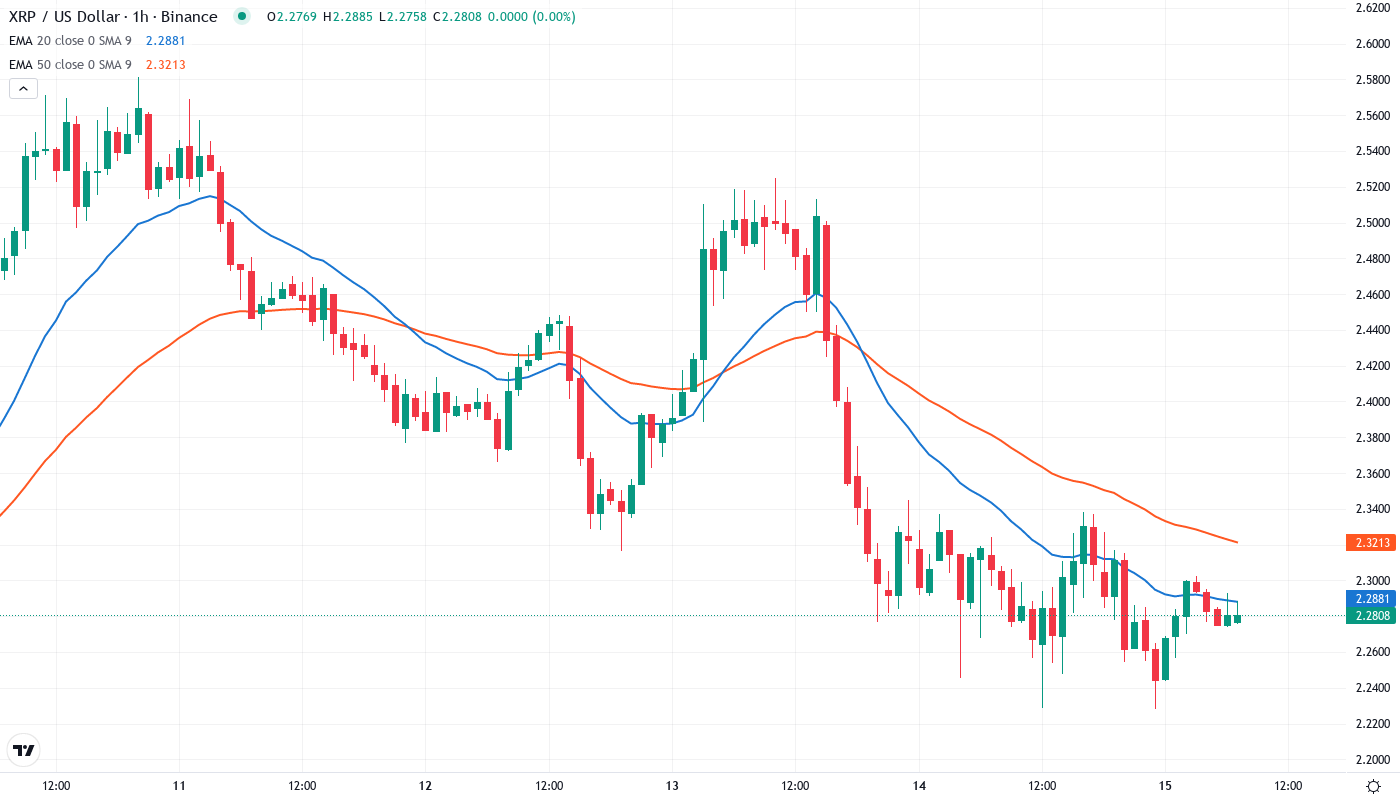
The EMA’s lagging behind the market action visually emphasize momentum that tends to decrease as they widen, making them useful for identifying potential reversals. The 20-day EMA features the tightest separation between the bulls and bears. Both the 20-day and 10-day EMAs have begun to bend downwards. This provides a hint for where prices could be headed next if the $2.62 level breaks-down.
What makes the current situation particularly interesting is that the 200-day EMA sits all the way down at $2.57, offering a safety net that hasn’t been tested since the rally began in November. The 10-day and 20-day EMA pinch indicates a volatility squeeze that’s likely to be resolved with a sharp directional move once the crypto market and the XRP market make up their minds. With the ETF and institutional catalyst and massive flows . any sustained move back above the 50-day EMA is likely to trigger stoos and gain momentum.
Resistance Stacks Between $2.52 and December’s $2.70 Peak
Sellers have control above the current price, building resistance levels that buyers need to overcome to regain control of the uptrend. The first obstacle is at $2.52, the 50-day EMA and a key round number, and a higher one near December’s peak of $2.70. R1 and R2 are quite optimistic at $3.48 and $4.45 according to monthly pivot points, levels that would need a consistent influx to be reached.
Buyers are currently in control, but it is likely they will grant sellers an opportunity to enter positions as the ETF outflows knock the price into the new support level. While the industry is likely to experience headwinds in the near term, the pipeline is robust, and growing acceptance among institutional investors should underpin industry leaders for years to come.
As long as XRP remains above $2.31 on any retracement, the market structure continues to show accumulation. The test of the $2.31 level produced a lower timeframe swing failure pattern and a quick recovery to the overhanging resistance zone. This is a bullish indicator on the intra-day timeframes. The volume profile during the announcement and anticipation of the ProShares ETF launch displayed legitimate interest, with the price advancing significantly on more than $58M traded and bought on the initial news day.
Bulls Need Decisive Reclaim of $2.52 to Reignite ETF Momentum
If XRP can close above the 50-day EMA at $2.52 with confidence, the price target above will be in play to potentially retest December’s $2.70 highs. The ETF in play does most of the heavy lifting in terms of fueling sustained demand, and the more institutional investors that are exposed to the crypto via such a regulated entity, the merrier.
If this scenario plays out, it’s best to step aside and wait for higher prices, joining the renewed buying interest triggered by a successful test at or above the 100-day EMA.
With the technical reset and another successful ETF launch, the most likely scenario is that XRP will consolidate in the 2.28-2.52 range and the recent move will be digested. This would give the moving averages time to catch up as well as give institutions the time to acquire exposures through the new ETF. The necessary condition for the trending move is the market to establish the immediate direction.