XRP Tests Critical Support at $2.02 as ETF Inflows Surge to $881 Million

Market Structure Shifts Higher
- XRP defends the $2.02 level after declining 29% from December highs while institutional ETF holdings climb to $881.25 million
- Technical indicators reset from overbought extremes, with RSI dropping to 40.64 and ADX showing trend strength moderating to 22.98
- Bulls now guarding higher lows they have set by taking back the critical psychological price level at $2.00
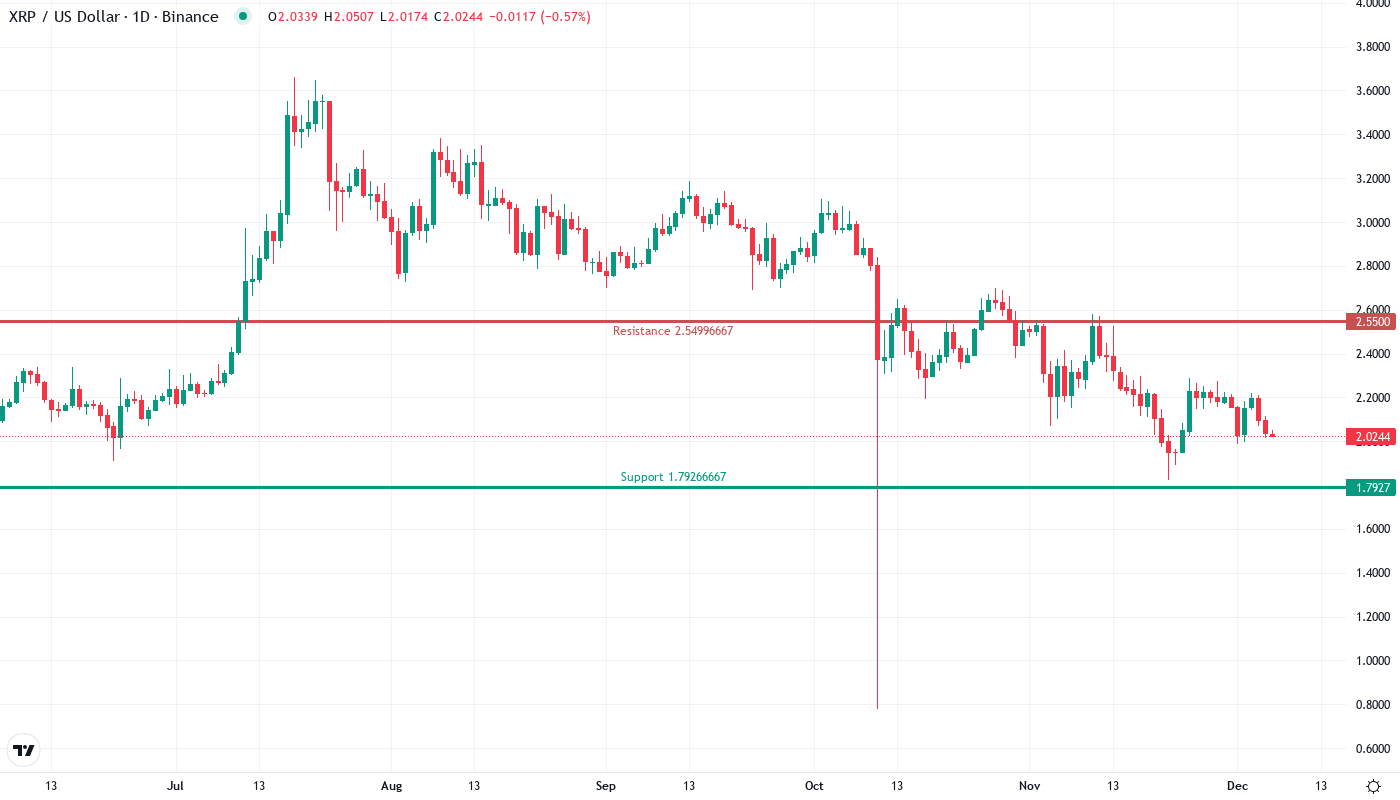
XRP has experienced a devastating drop of 29% from its December peak of $2.58, yet the cryptocurrency demonstrates remarkable resilience at the $2.02 support zone that has been tested six times since June. The decline, which accelerated after regulatory uncertainty clouded the market, has now met substantial institutional buying pressure as evidenced by 13 consecutive days of ETF inflows pushing total holdings to $881.25 million. The main question for traders is: can this institutional bid defend current levels and kick-start a recovery, or will technical weakness overwhelm the fundamental support?
| Metric | Value |
|---|---|
| Asset | XRP (XRP) |
| Current Price | $2.02 |
| Weekly Performance | -7.15% |
| Monthly Performance | -13.57% |
| RSI (Relative Strength Index) | 40.6 |
| ADX (Average Directional Index) | 23.0 |
| MACD (MACD Level) | -0.06 |
| CCI (Commodity Channel Index, 20-period) | -77.20 |
Momentum Resets to 40.64 After December’s Overbought Extreme
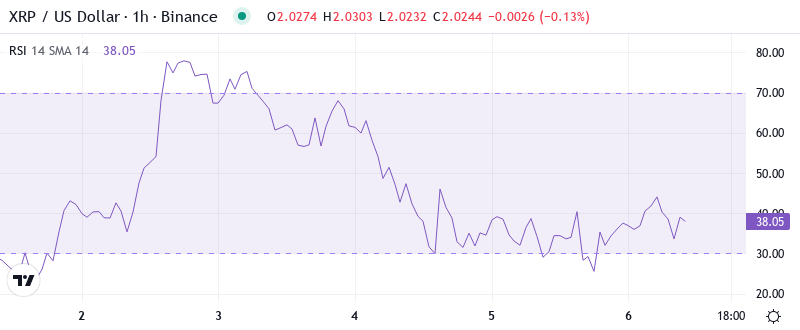
Reading the oscillator at 40.64 on the daily timeframe, traders see momentum has cooled significantly from the overbought readings above 70 that marked December’s euphoric peak. This reset brings XRP into territory where previous accumulation phases began – particularly noteworthy is how similar RSI configurations in September preceded a 40% surge within three weeks. The 13-day ETF inflow surge aligns perfectly with this momentum reset, suggesting institutions are viewing this pullback as an entry opportunity rather than a trend reversal signal.
What’s revealing is how RSI behaved during the decline – rather than capitulating into deeply oversold territory below 30, it found support at 40, indicating sellers aren’t panicking despite the sharp price drop. So for swing traders, this balanced RSI reading at 40.64 means downside momentum is exhausting while leaving room for a potential bounce without immediate overbought concerns. The weekly RSI at 39.99 confirms this multi-timeframe reset, positioning XRP for its next directional move with momentum neither stretched nor exhausted.
ADX at 22.98 Signals Shift From Trending to Consolidation Phase
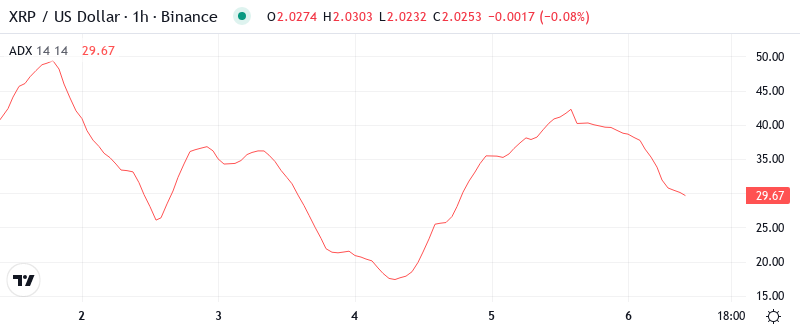
At the level of 22.98, the ADX entry indicates that the powerful downtrend from December highs is losing steam as it drops below the crucial 25 threshold. Basically, being in this zone means we’re transitioning from trending conditions that favored momentum strategies to a more balanced market structure where range-trading approaches become viable. The shift coincides with XRP finding support at the psychologically important $2.00 level, reinforced by growing ETF holdings that reached $881.25 million.
Looking at trend strength evolution, the ADX peaked above 40 during December’s rally before reversing sharply during the subsequent decline. To clarify, the ADX is indicating that we are switching from directional extremes to consolidation conditions where support and resistance levels gain importance. Therefore, day traders should adapt their strategies to this change – expect more ping-pong action between defined levels rather than sustained directional moves until ADX climbs back above 25 with conviction.
20-Day EMA at $2.15 Flips From Support to Resistance After December Break
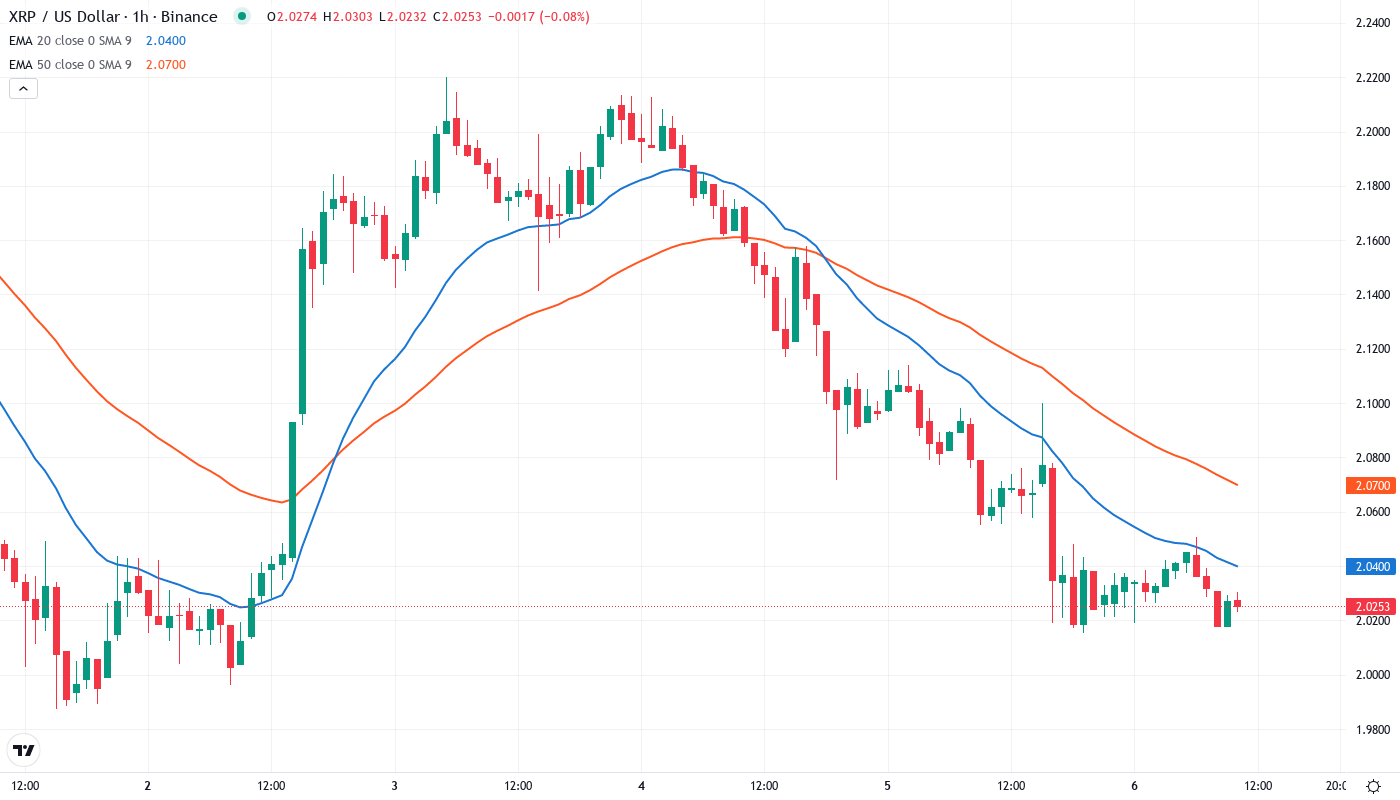
Price action through the EMA ribbons tells a clear story of structural deterioration followed by potential stabilization. XRP currently trades below the 10-day ($2.11) and 20-day ($2.15) EMAs but crucially holds above the 50-day EMA at $2.29 which has transformed into a resistance level after supporting price throughout November’s accumulation phase. The fact that institutions accumulated $881.25 million in ETF holdings while price compressed between these averages suggests they’re betting on a reclaim of short-term EMAs rather than further breakdown.
Moving averages paint an interesting confluence zone between $2.29-$2.31 where the 50-day EMA converges with previous support levels. This former support area at $2.31 now transforms into a red line for the bulls to defend on any relief rallies – failure to reclaim it would confirm the structural shift from uptrend to potential range or further decline. Meanwhile, the 200-day EMA sits far below at $1.86, providing a distant safety net that coincides with summer 2024 accumulation zones where the current ETF buying spree originally began.
Resistance Stacks Heavy Between $2.31 and $2.58 as Bulls Eye Recovery
The immediate resistance clusters between $2.31 (50-day EMA and former support) and $2.52 where December’s breakdown accelerated, creating a formidable barrier for any recovery attempts. Above that, the December highs at $2.58 represent the ultimate test for bulls – this level has transformed from a breakout point to a major resistance zone that would need significant volume to overcome. ETF inflows provide the fundamental catalyst, but technical confirmation requires a decisive close above $2.31 to shift near-term structure bullish.
Support architecture builds from the current $2.02 level down to $1.86 where the 200-day EMA provides major technical support. Bulls have defended $2.02 aggressively, with each test accompanied by increasing ETF inflows – the latest surge to $881.25 million in holdings occurred precisely as price bounced from this level for the sixth time. The ability to use XRP as collateral in the U.S. adds fundamental support to these technical levels, expanding utility beyond simple speculation.
Market structure reveals a compression pattern between $2.02 support and $2.31 resistance that resembles previous consolidation phases before major moves. The convergence of declining ADX, reset RSI, and institutional accumulation at technical support creates a coiled spring setup. This configuration historically resolved with explosive moves in either direction – the December rally emerged from similar compression, while the 2022 bear market saw comparable patterns break lower.
Bulls Need Decisive Close Above $2.31 to Confirm Trend Reversal
Bulls require a convincing reclaim of the $2.31 level where the 50-day EMA converges with former support – this would flip market structure bullish and target the $2.52-$2.58 resistance zone. The expanding XRP utility as U.S. collateral combined with sustained ETF inflows provides fundamental fuel for such a move, but technical confirmation demands volume expansion and daily closes above key resistance. Should momentum build, the measured move from current consolidation targets $2.72.
Bearish pressure intensifies if $2.02 support fails after six successful defenses – such a breakdown would likely trigger stop-loss cascades targeting the 200-day EMA at $1.86. The setup invalidates entirely on a daily close below $2.00, which would trap recent ETF buyers and potentially accelerate selling despite institutional accumulation. This scenario gains probability if ETF inflows reverse or regulatory headwinds intensify beyond current uncertainties.
Given the technical reset in momentum indicators, institutional accumulation at support, and expanding fundamental utility, the most probable near-term path sees XRP consolidating between $2.02-$2.31 while building energy for the next directional move. The 13-day ETF inflow streak and $881.25 million in holdings suggest institutions are positioning for upside, but technical confirmation awaits a break above $2.31 resistance with conviction.