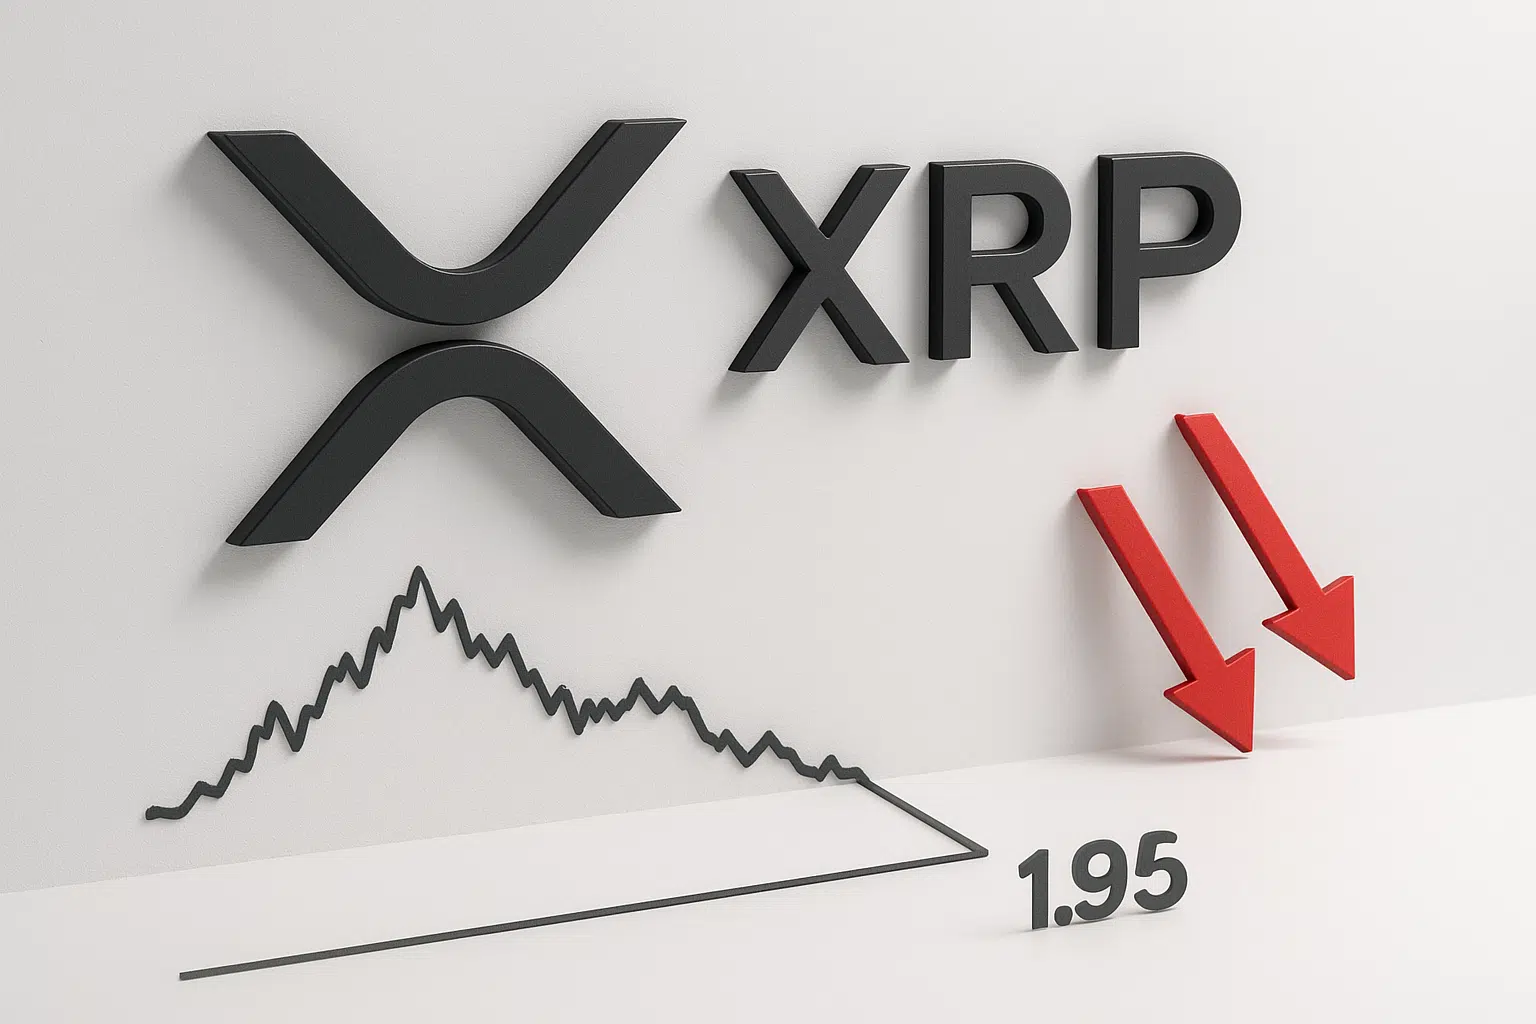
XRP Tests Critical $1.95 Support as ETF Launch Momentum Fades
Market Structure Shifts Lower
- XRP lost 17.5% over the past week as ETFs began trading on the US stock market.
- Technical indicators suggest the market is oversold.
- XRP saw its worst weekly performance in five months, including a range-trading head fake inspired by the White Swan ETF announcement that faced an outright rejection from regulators.

The assets under management (AUM) of Bitwise’s XRP ETF Trust (XRPZ) and Grayscale’s XRP Trust (XRP) barely entered seven digits, a far cry from the tens of billions of dollars that grayscale trusts and the discontinued physical XRP ETP had accrued. Potentially causing sticker shock, Bitwise disclosed that the XRP in XRPZ may never be worth more than the ETF shares until arbitrageurs can redeem the underlying asset for XRP.
| Metric | Value |
|---|---|
| Asset | XRP (XRP) |
| Current Price | $1.95 |
| Weekly Performance | -13.16% |
| Monthly Performance | -17.51% |
| RSI (Relative Strength Index) | 31.6 |
| ADX (Average Directional Index) | 37.4 |
| MACD (MACD Level) | -0.13 |
| CCI (Commodity Channel Index, 20-period) | -182.40 |
Momentum Exhaustion Hits 31.57 – Lowest Since October Capitulation
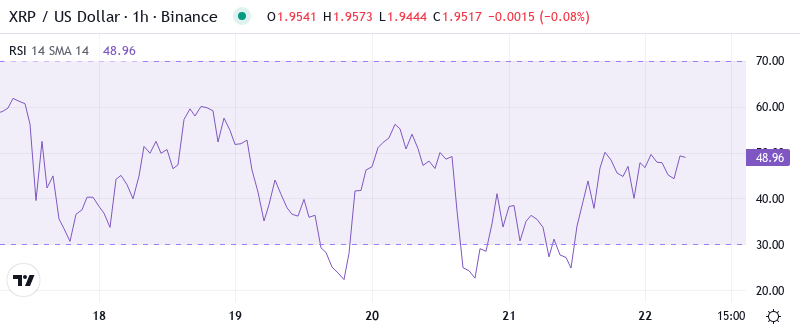
With XRP quietly trying to bottom for over three months now and searching for a spark plug that can go the distance (perhaps from the SEC lawsuit or an overdue catalyst from Ripple), a sustained breach of early January’s close could provide the required downside flush to put the token in a healthier position longer-term. Addressing the downside structure’s insufficiencies while ideally wringing out more excessive bullish positioning/start long liquidation commitment, the inevitable good news must finally be worth more than the bad news.
Therefore, the best course of action is to remain patient and wait for the momentum reset to indicate that the upswing has fully played out. Before celebrating the Bass Pro ribbon cutting and flocking the shallow narrative, we would need to see RSI take out support near the 40 level to be certain the worst of the washout is over.
ADX at 37.43 Signals Mature Downtrend Nearing Exhaustion
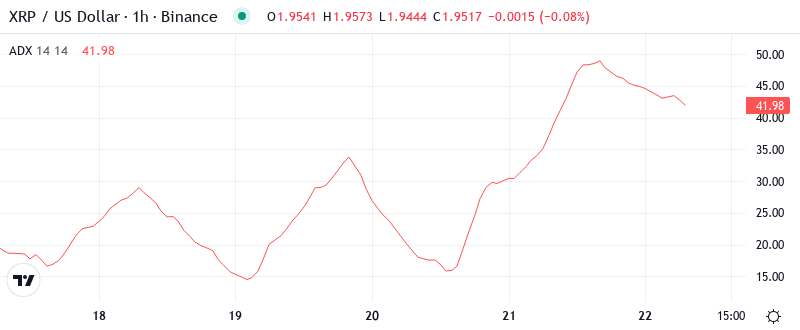
The ADX reading is an extreme measure of directional movement suggesting that sellers are becoming overzealous in their defense of XRP price peaks and are willing to push lower/higher in order to force capitulation. Conversely, profit taking also reaches a level of extremes where further declines/advances attract a new wave of buying/selling.
What is really notable about this latest price jump is how fast the trend strength came on as just last week the ADX was at a benign 22. In this context, the ADX alerts the marketplace that we are moving from a consolidated environment into a trending environment, but at current levels trading in the VanEck Vectors Rare Earth/Strategic Metals ETF (NYSEARCA:REMX) demands recognition of the fact that the rubber band is extended. In other words, day traders had better be ready for either capitulation under $1.95 or an explosive snapback rally as the shorts cover into overextended levels.
20-Day EMA at $2.22 Flips From Support to Resistance Barrier
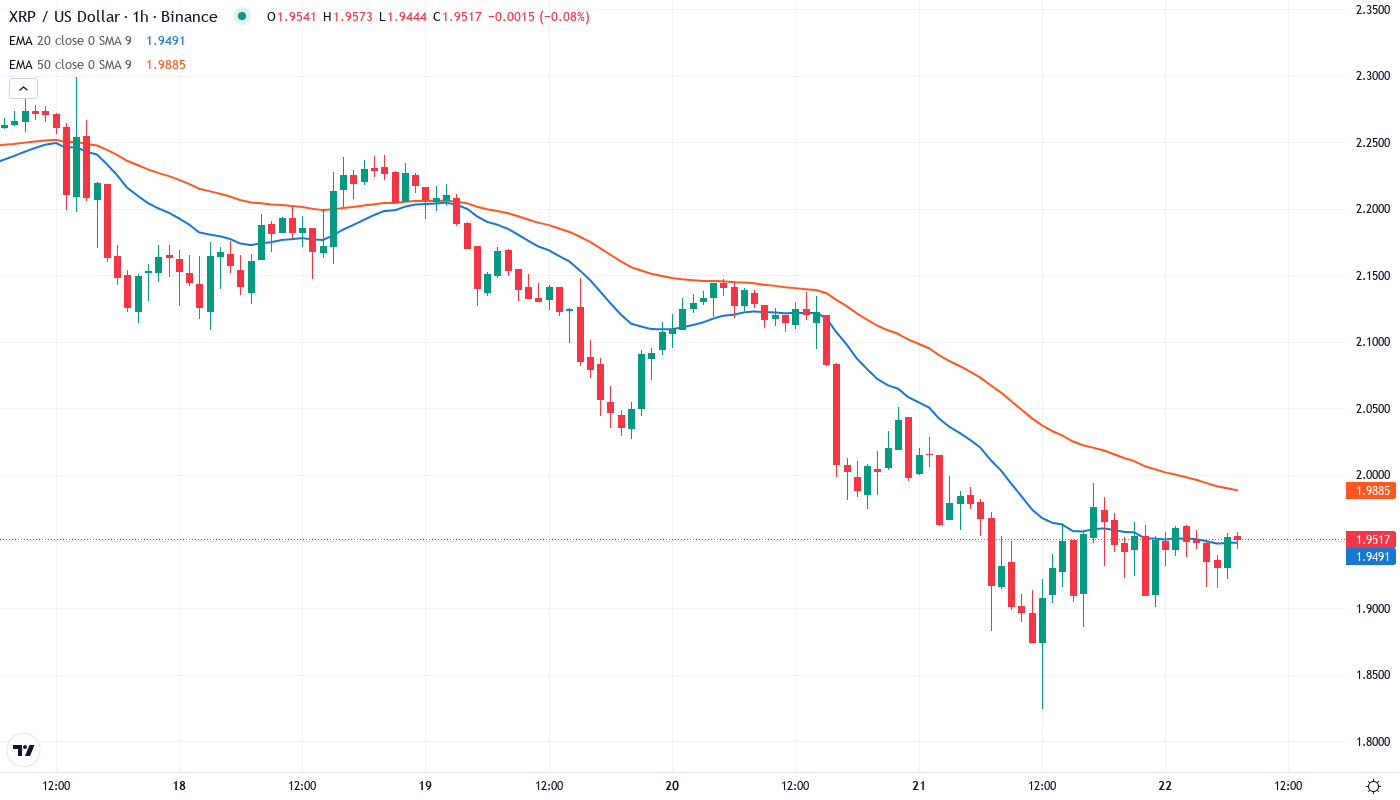
The impending ‘death cross’ of the 20-day below the 50-day will continue to unnerve stakeholders, an immediate deleterious technical signal that reinforces rapacious short-term sentiment. The 50-day, having clearly failed to support price this week, will emerge as critical overhead resistance if the SEC decision triggers a sell-off next week. The 100-day, which hasn’t been breached for over four months, will loom into view below $1.90.
The critical 50-day EMA at $2.30 is now resistance that bulls must take back to the upside to change momentum. Bears will be defending that former support zone as a red line, and any rally will likely be capped there unless bulls can bring in an influx of volume. The Positive XRP trades higher than the 200-day EMA at approximately $1.85. This keeps the macro uptrend structure intact despite the latest selloff.
$1.95 Support Faces Moment of Truth After Six Successful Defenses
Sellers will struggle to find a better entry than they have right now to continue driving this stock into the ground. The downtrend has been extremely strong and even oversold oscillators are having trouble triggering a recovery rally. The most likely scenario is that the 100% drop retracement completes at the 2016 bottom just above a buck. This has 10-20% downside from here and minimal upside if that bottom breaks after four years of exhaustion.
Bulls are holding a line in the sand at $1.95, which has thwarted six distinct assaults since June. Weekly bottom at $1.82 lends a helping hand but if $1.95 falls, stop level orders are likely to be triggered, with the 200 day EMA at $1.85 the target. Volume profiles indicate substantial buying taking place in the $1.90-$1.95 range, implying entities are regarding this level as valued – however, they will not wait forever.
The market structure did not change last week and continues to show the classic “sell the news” pattern, with positive fundamentals (ETF launches) meeting technical resistance (overbought RSI) at the worst possible time. Such a setup we last observed in March 2024 at the local top, when comparable institutional euphoria led to a 40% correction. The key difference this time: there were no clear levels to lean on overhead. This is not the case today where over the last few weeks levels have been well defined. The ETF infrastructure is also a long-term bullish catalyst once the technical outlook improves.
Bulls Need Decisive Reclaim of $2.15 to Stem the Bleeding
If the price can go back above the $2.15 monthly pivot point, bulls will likely aim to test the 20-day EMA at $2.22 next. Unlike prior uptrends, real ETF trading volume remains a supportive fundamental factor this time around — but still, technical damage must be repaired, and premature re-entry will only result in further losses.
If the support at $1.95 is lost with substantial volume, the price will most likely re-enter the preceding trading zone ($1.95 – $2.27). This would lead to a decline toward the 200-day exponential moving average where new bids might cluster ($1.85). If the price continued below this barrier, the swing low at $1.82 could temporarily prevent a further decline.
With momentum indicators reaching oversold levels and the $1.95 level being defended six times, it is likely that XRP consolidates in the near-term between $1.95-$2.15 and digests the ETF launch letdown. This side-ways grind will allow technical indicators to reset with out breaking critical support levels and would set up a healthier advance once the broader market realizes that ETF inflows take time to accumulate.