XRP Consolidates at $2.03 as ETF Inflows Build Pressure Against $2.30 Resistance
Market Structure Shifts Higher
- XRP trades at $2.03 after declining 27% from December highs, yet ETF inflows extend to 13 consecutive days
- Momentum indicators reset from overbought extremes while price holds above critical 50-day EMA support
- Bulls defend $2.02 support zone as institutional flows near $1 billion milestone
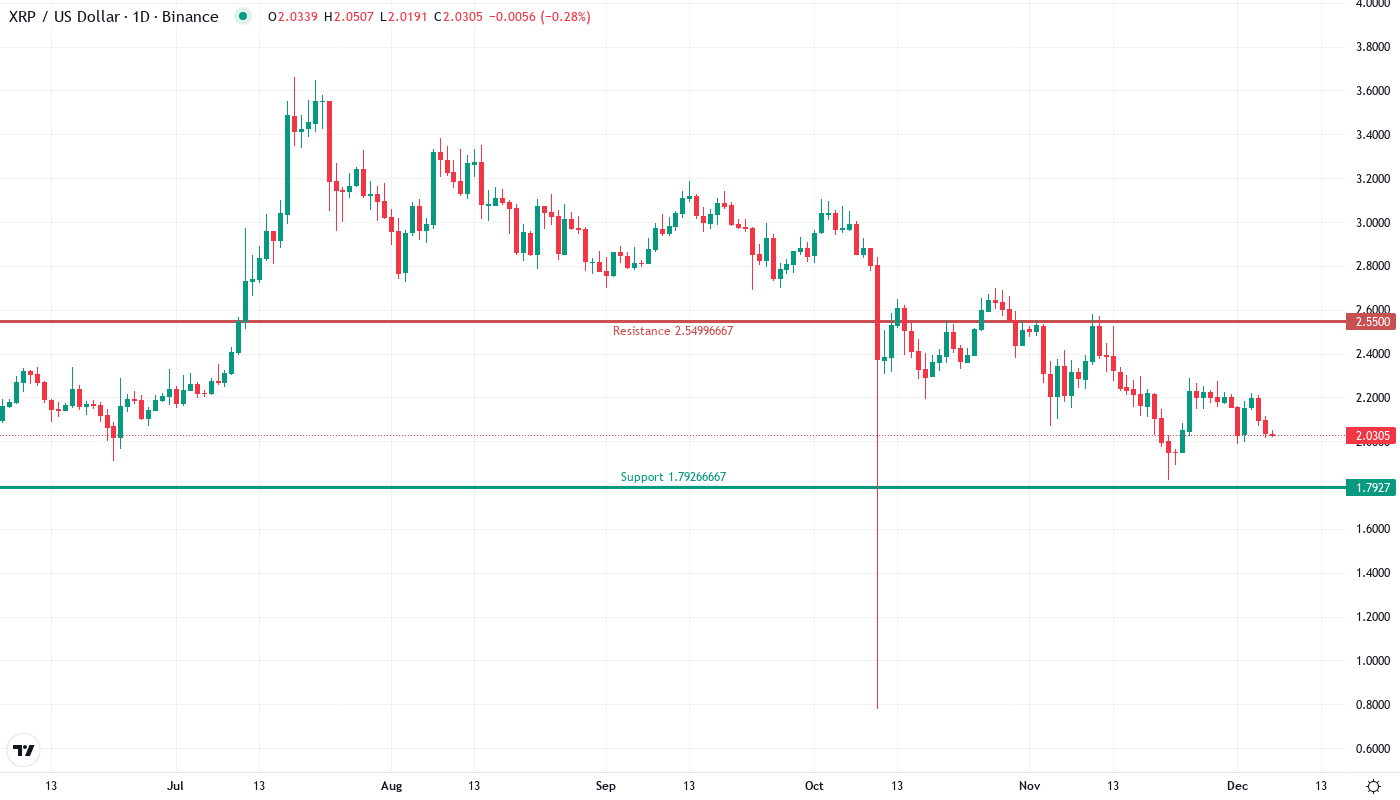
XRP’s price action tells a story of resilience amid broader market pressure, with the token currently trading at $2.03 after shedding 27% from its monthly high of $2.58. The devastating drop from those December peaks hasn’t deterred institutional buyers, who’ve maintained an unprecedented 13-day streak of ETF inflows that’s approaching the $1 billion milestone. The main question for traders is: can this institutional bid provide enough wind to the sails for bulls to reclaim the critical $2.30 resistance level that’s capped advances three times this month?
| Metric | Value |
|---|---|
| Asset | XRP (XRP) |
| Current Price | $2.03 |
| Weekly Performance | -6.70% |
| Monthly Performance | -13.16% |
| RSI (Relative Strength Index) | 41.1 |
| ADX (Average Directional Index) | 23.0 |
| MACD (MACD Level) | -0.06 |
| CCI (Commodity Channel Index, 20-period) | -74.24 |
Momentum Cools to 41.08 After December’s Overbought Spike
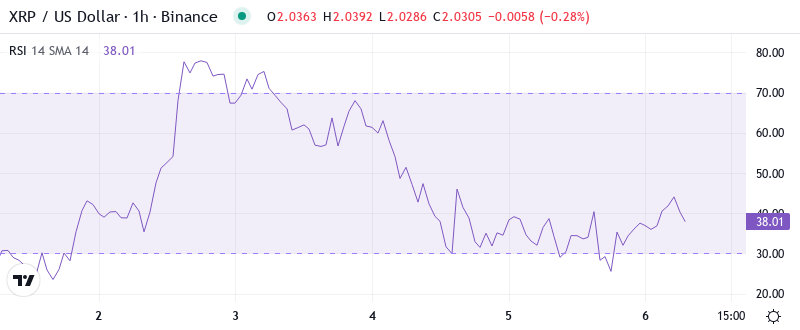
RSI sits at 41.08 on the daily timeframe, marking a significant reset from the overbought conditions that preceded December’s sharp reversal. This reading places momentum in a zone where previous accumulation phases began – particularly notable given the August bottom formed with RSI at similar levels before XRP’s subsequent 180% rally.
What’s revealing is how RSI behaved during the recent decline: despite the 27% price drop, the oscillator avoided capitulation territory below 30, suggesting sellers lack conviction. So for swing traders, this balanced RSI configuration combined with sustained ETF inflows creates a setup where dip-buyers might emerge, especially if price tests the $2.00 psychological level again.
ADX at 22.98 Signals Shift From Trending to Consolidation Phase
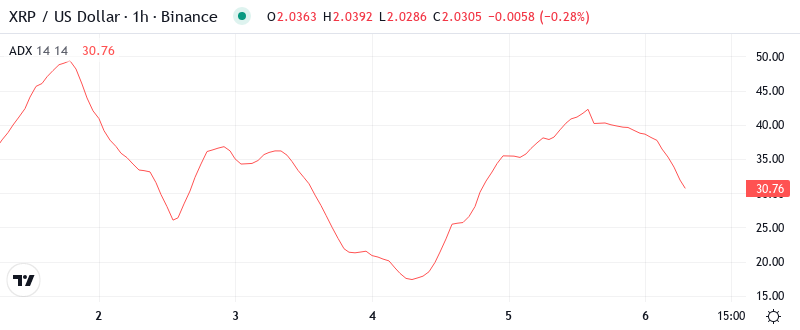
Looking at trend strength indicators, the ADX reading of 22.98 tells us the market has transitioned from December’s powerful trending conditions back into a consolidation phase. The shift below 25 occurred precisely as ETF flows accelerated, suggesting institutional buyers are accumulating during this period of reduced volatility rather than chasing momentum.
Basically, this ADX level indicates we’re in a compression phase where range-trading strategies work better than trend-following approaches. The combination of weakening trend strength and persistent institutional buying through ETFs creates conditions ripe for a volatility expansion – likely triggered once price decisively breaks either the $2.30 resistance or $2.00 support.
50-Day EMA at $2.29 Transforms From Support to Key Resistance
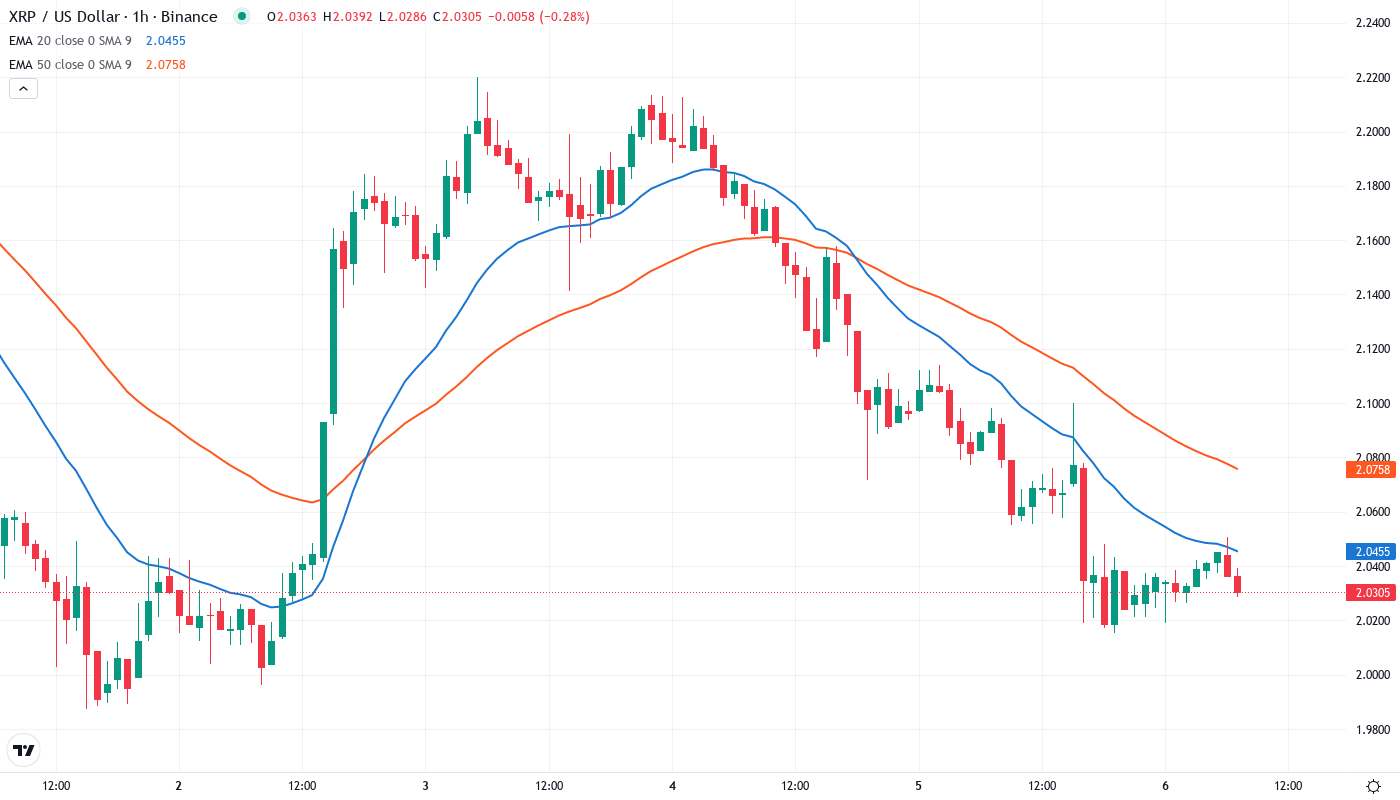
Price action through the EMA ribbons reveals a critical structural shift. XRP currently trades below the 10-day ($2.11), 20-day ($2.15), and crucially, the 50-day EMA at $2.29 – a level that supported price throughout November’s rally before flipping to resistance during December’s reversal. The 100-day EMA sits distant at $2.45, while the 200-day provides a safety net down at $1.86.
Most significant is how the 50-day EMA now converges with the psychological $2.30 level, creating a double barrier that rejected advances three times since mid-December. This confluence zone becomes the red line for bulls to reclaim – especially relevant given that ETF buyers have been defending positions near current levels for two straight weeks.
Double Resistance at $2.30-$2.31 Gates Recovery as Support Builds at $2.02
Resistance stacks heavy between $2.30 and $2.31, where the 50-day EMA meets horizontal resistance from December’s multiple rejections. Above that, the monthly pivot at $2.55 and December highs near $2.58 represent the next major hurdles should bulls manage to break through. The psychological $2.50 level sits between these zones, likely attracting profit-taking from any relief rally.
Bulls now guard the $2.02-$2.03 support zone with conviction, as evidenced by six successful defenses over the past week despite broader market weakness. Below that, the $1.93 level (matching the weekly pivot S1) offers secondary support, while the 200-day EMA at $1.86 provides a distant but critical floor. It is worth mentioning that the $2.00 psychological level has attracted consistent ETF buying, suggesting institutional players view sub-$2 prices as accumulation opportunities.
The market structure reveals a coiled spring formation between $2.00 and $2.30, with decreasing volatility as price compresses into this range. This setup typically resolves with a sharp directional move – and given the sustained ETF inflows approaching $1 billion, the institutional bid could provide the catalyst for an upside resolution if broader crypto sentiment improves.
Bulls Need Decisive Close Above $2.31 to Confirm ETF-Driven Recovery
For bulls to validate the institutional accumulation thesis, XRP needs a convincing daily close above $2.31 that flips the 50-day EMA back to support. Such a move would target the monthly pivot at $2.55, with momentum potentially extending toward December highs at $2.58 if ETF flows maintain their current pace.
The bearish scenario triggers if XRP loses the $2.00 psychological support on volume, which would likely flush leveraged longs and create an air pocket down to the 200-day EMA at $1.86. This would signal that even billion-dollar ETF inflows can’t overcome broader market headwinds, potentially trapping recent institutional buyers.
Given the technical setup and unprecedented institutional interest, the most probable near-term path sees XRP consolidating between $2.00 and $2.30 while ETF flows continue building. This accumulation phase should resolve by month-end, with the direction likely determined by whether Bitcoin can reclaim $100K to restore broader market confidence.