XLM Tests Critical Support at $0.258 as Tokenization Momentum Builds
Market Structure Shifts Higher
- Stellar trades at decade-low support while institutional tokenization projects accelerate
- RSI momentum completely reset from overbought extremes, creating reload opportunity
- Six-time tested $0.172 floor emerges as final defense for bulls

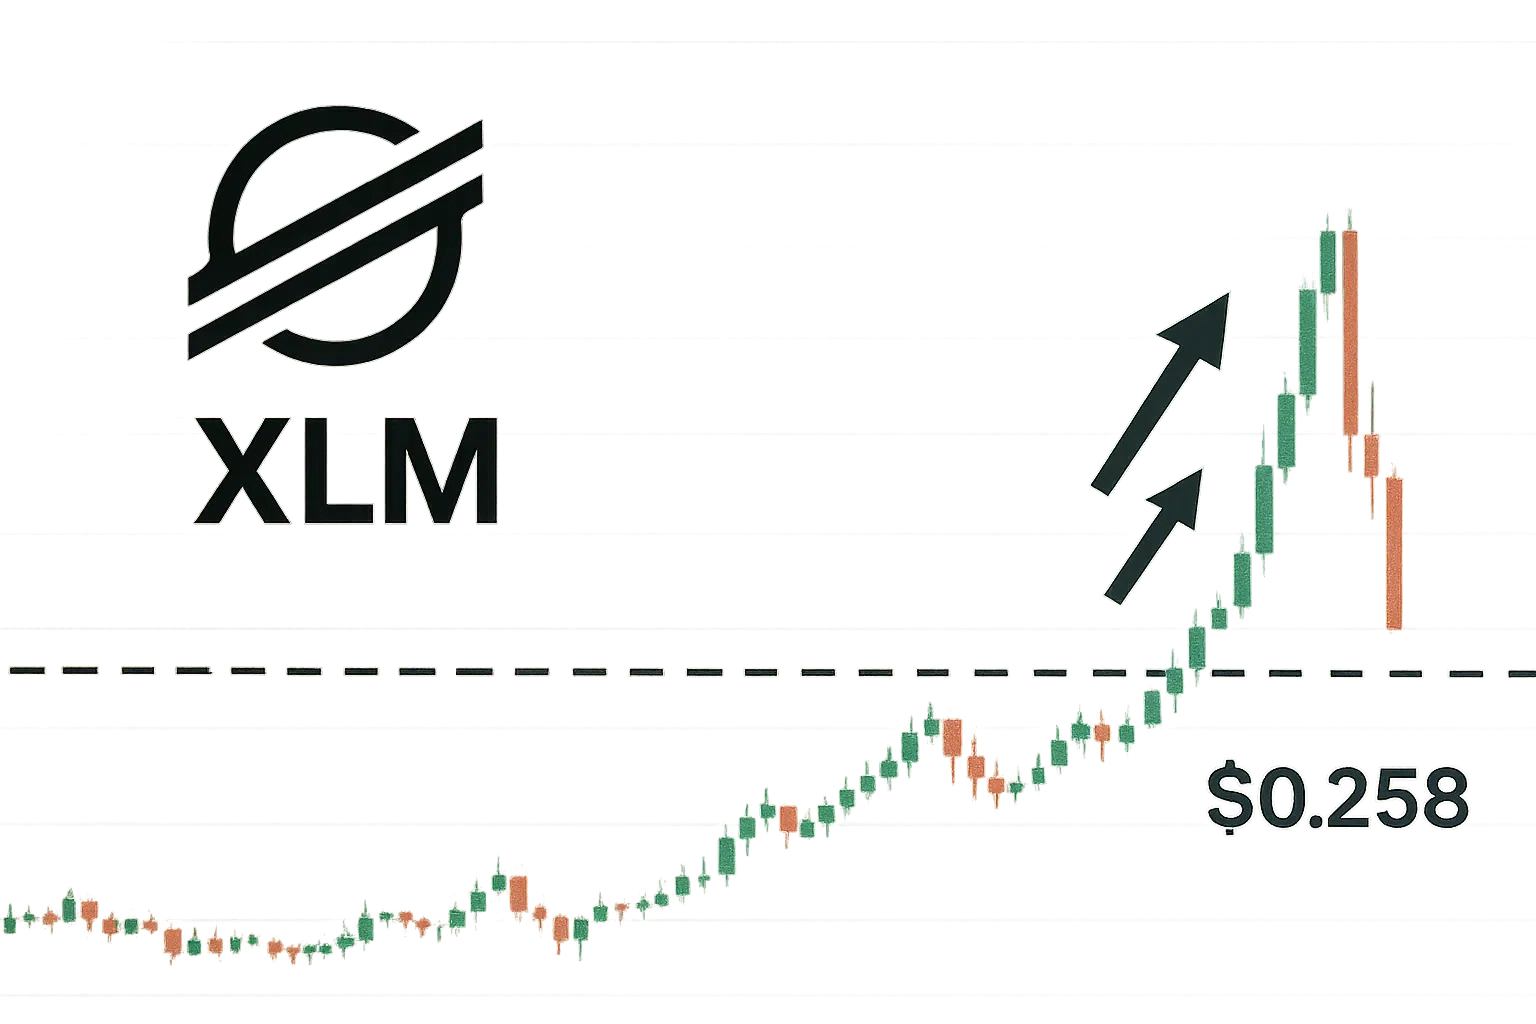
Stellar has endured a devastating 37.8% decline over three months, shedding roughly $0.155 from its yearly high of $0.337 as the broader crypto market corrected. The tokenization powerhouse now trades at $0.258, testing support levels last seen during accumulation phases, even as institutional adoption accelerates through partnerships with Turbo Energy for solar financing and THORWallet’s cross-chain infrastructure. The main question for traders is: will expanding real-world utility provide the floor for price recovery, or does technical weakness override fundamental progress?
| Metric | Value |
|---|---|
| Asset | STELLAR (XLM) |
| Current Price | $0.26 |
| Weekly Performance | -9.83% |
| Monthly Performance | -16.39% |
| RSI (Relative Strength Index) | 35.7 |
| ADX (Average Directional Index) | 45.5 |
| MACD (MACD Level) | -0.02 |
| CCI (Commodity Channel Index, 20-period) | -126.76 |
Momentum Completely Resets After December’s Overbought Peak
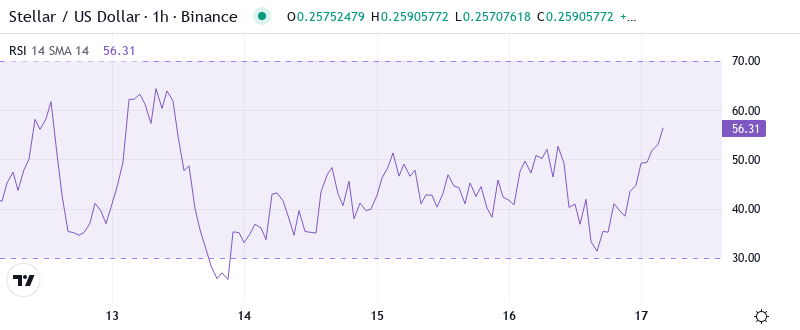
RSI sits at 35.69 on the daily timeframe, marking the first oversold reading since the August washout that preceded XLM’s 16.8% yearly gain. This dramatic reset from overbought territory above 70 in early December represents a full momentum cycle, with sellers exhausting their ammunition as tokenization news failed to sustain the rally.
What’s revealing is how RSI behaved during the decline – rather than bouncing at the neutral 50 level that typically holds in uptrends, momentum sliced straight through to oversold territory. Similar configurations in September 2023 preceded multi-week consolidation periods before the next leg higher, suggesting patient accumulation may reward buyers who recognize the tokenization catalyst building beneath current price weakness.
ADX at 45.45 Signals Mature Downtrend Nearing Exhaustion
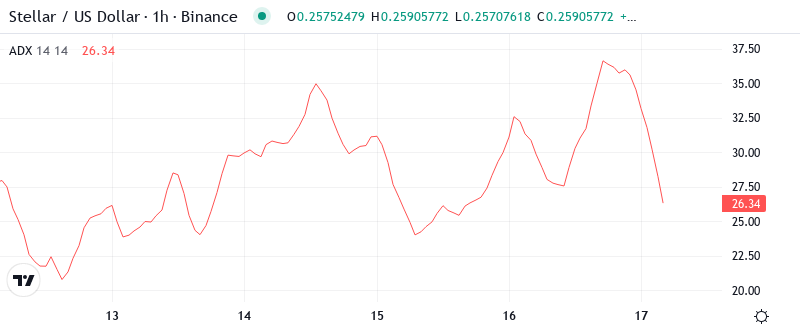
Looking at trend strength, the ADX reads an extreme 45.45, indicating the bearish move has reached conviction levels rarely sustained for extended periods. Basically, this reading tells us sellers have pushed with maximum force, but such extremes often mark capitulation phases rather than trend continuation.
To clarify, the ADX is indicating we’re approaching a turning point where either bears reload for another leg down or exhaustion allows bulls to stabilize price. Therefore, day traders should prepare for potential volatility expansion as this mature trend resolves, with Stellar’s expanding tokenization ecosystem potentially providing the fundamental spark for reversal.
50-Day EMA at $0.283 Becomes First Recovery Target
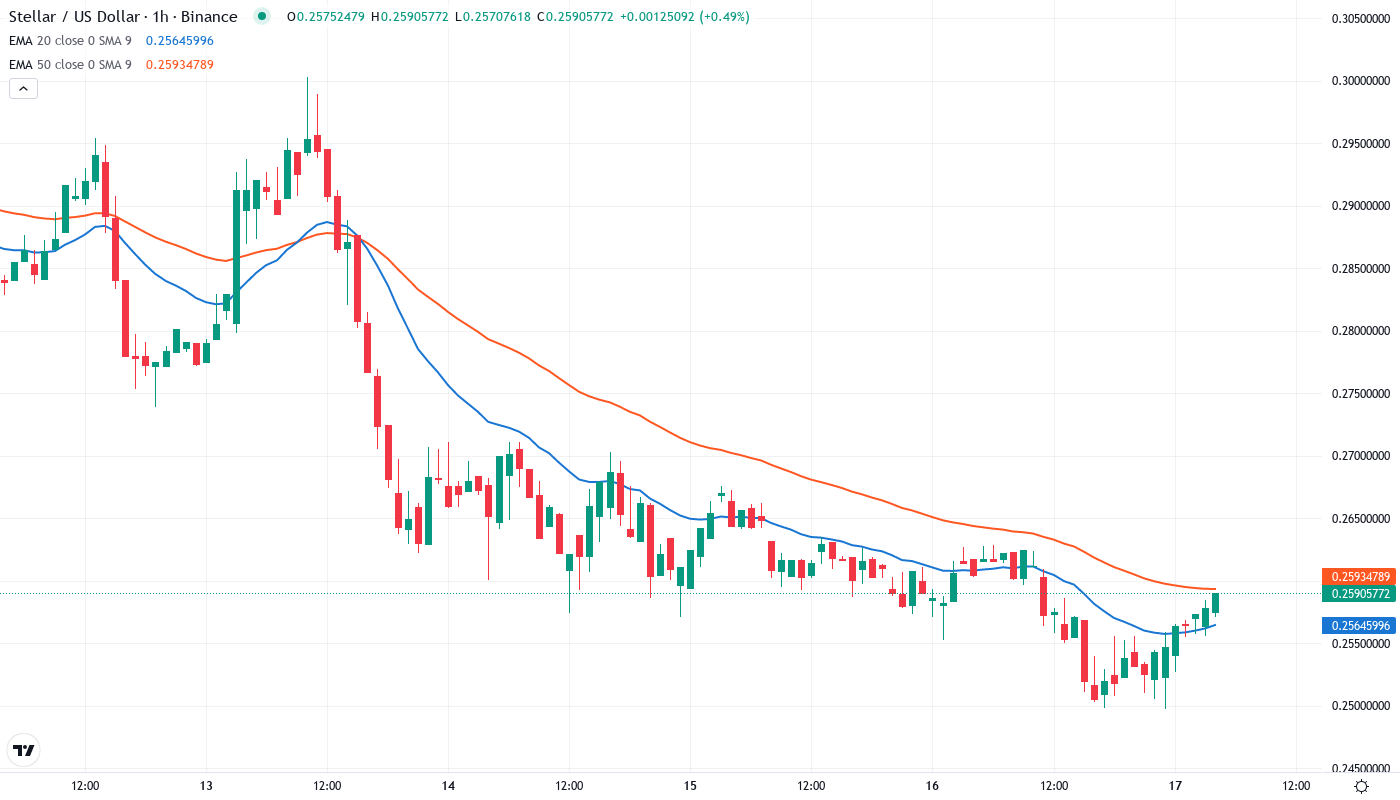
Price action reveals a clear bearish structure with XLM trading below the entire EMA ribbon – beneath the 10-day ($0.270), 20-day ($0.282), and crucially the 50-day EMA at $0.283. This complete breakdown of moving average support occurred as tokenization announcements failed to offset broader market selling pressure.
Interestingly, the compression between the 20-day and 50-day EMAs creates a resistance cluster in the $0.282-$0.283 zone that bulls must reclaim to signal any meaningful recovery. That former support area now transforms into the first major hurdle, with sustained closes above needed to attract momentum traders back to the tokenization narrative.
Support Architecture Builds From $0.172 to Current Levels
Above current price, sellers have fortified positions between the monthly pivot at $0.296 and the psychological $0.30 level where December’s rally stalled. This resistance zone gains additional weight from the 100-day EMA at $0.294, creating a triple confluence that caps near-term upside potential.
Bulls defend a more complex support structure anchored by the six-time tested $0.172 level that held throughout 2024’s volatility. The immediate support sits at $0.236 (20-day EMA on weekly timeframe), with the critical $0.212 level (200-day EMA on daily) providing intermediate defense before the ultimate floor.
Market structure reveals accumulation patterns as long as price maintains above $0.236 on any retracement. The convergence of tokenization developments with oversold technicals creates an asymmetric risk-reward scenario, particularly given the Turbo Energy solar financing pilots and THORWallet integration expanding XLM’s utility beyond traditional payment rails.
Bulls Need Decisive Close Above $0.283 to Confirm Tokenization Rally
Should price reclaim the 50-day EMA at $0.283 with conviction, bulls can target the resistance cluster at $0.296-$0.30 where monthly pivots meet psychological barriers. The expanding tokenization ecosystem – from solar debt instruments to cross-chain swaps – provides fundamental catalysts that could fuel sustained recovery if technicals align.
The bearish scenario triggers if XLM loses the $0.236 weekly support on volume, exposing the 200-day EMA at $0.212 as the next target. Such a breakdown would trap recent tokenization narrative buyers and likely flush positions toward the battle-tested $0.172 floor where serious accumulation historically emerges.
Given the extreme oversold conditions meeting expanding real-world utility through tokenization partnerships, the most probable near-term path sees XLM consolidating between $0.236-$0.283 while momentum indicators reset. This base-building phase would allow the fundamental tokenization story to catch up with price action before the next directional move.


