XLM Tests Critical Support at $0.236 as ISO 20022 Compliance Meets Market Reality

Market Structure Shifts Lower
- The current trade at $0.236 is running at a monthly loss of 24.1%, following the trend of most of the altcoins.
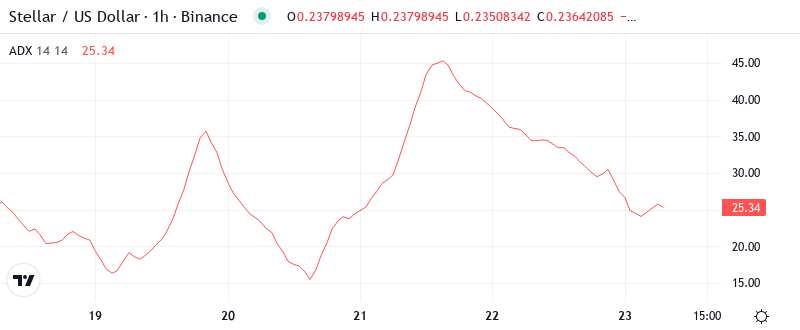
- Relative Strength Index is currently holding a neutral at 44.2 and Average Directional Index is at 48.4, indicating the strengthening of the downtrend.
- The rise in the selling pressure is subsequently pulling the price further below 50-day and 200-day daily moving averages (DMA).
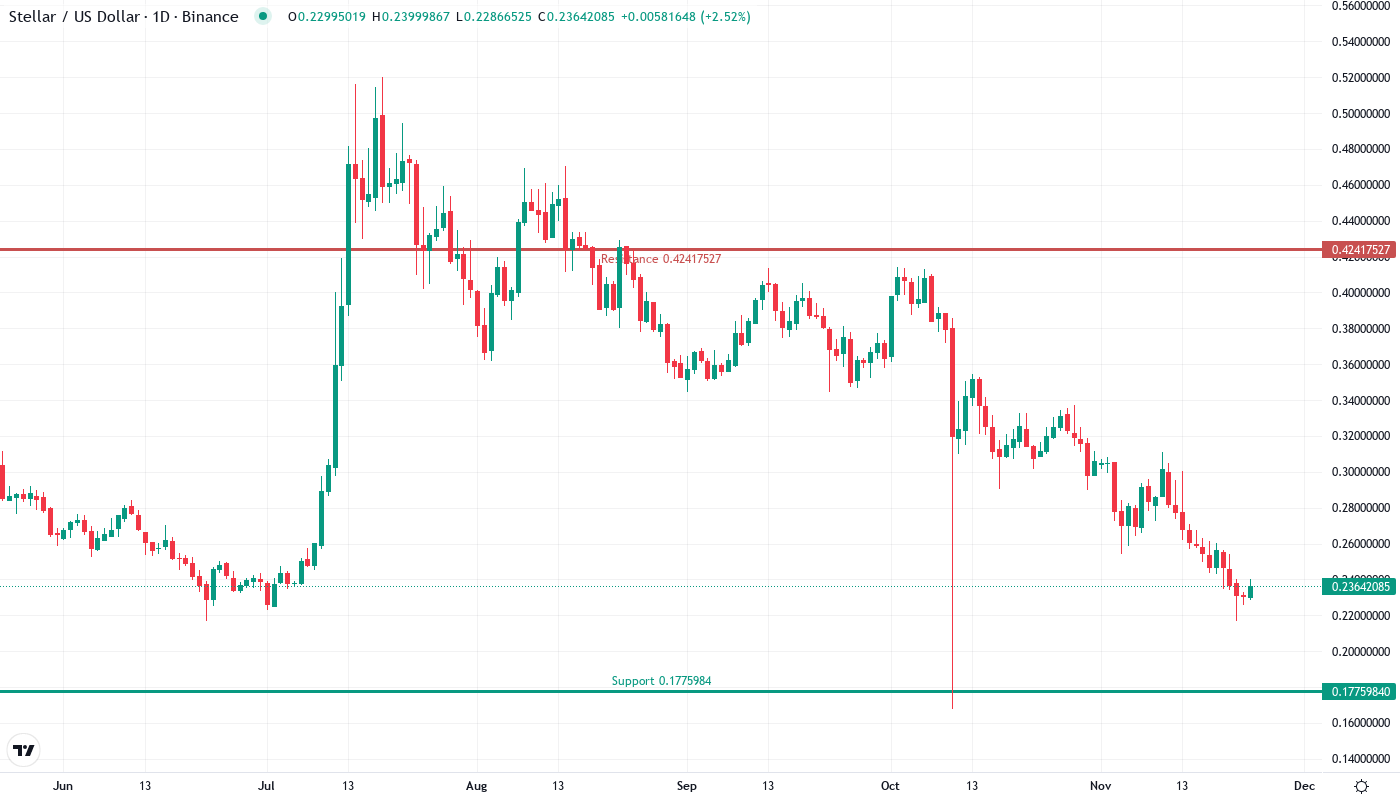
The price of XLM continued to plummet, shedding 24.1% over the past month to trade at $0.236 and erasing September’s gain. The retreat from the recent monthly high formed at $0.337 in early September started to intensify when the buyers failed to reach a key resistance level at $0.306 with sufficient momentum. Moreover, the recovery was capped by the 100-monthly moving average. A new bearish correction only gained traction on the XLM/USD chart when the altcoin breached the 50% Fibonacci retracement of the recent micro-bull rally from $0.161 to $0.337. Co-incidentally, this fractal level coincides with the support of a steep underlying trend line.
| Metric | Value |
|---|---|
| Asset | STELLAR (XLM) |
| Current Price | $0.24 |
| Weekly Performance | -8.52% |
| Monthly Performance | -24.11% |
| RSI (Relative Strength Index) | 33.3 |
| ADX (Average Directional Index) | 48.4 |
| MACD (MACD Level) | -0.02 |
| CCI (Commodity Channel Index, 20-period) | -111.27 |
Momentum Neutral at 44.2 Despite Month-Long Selloff
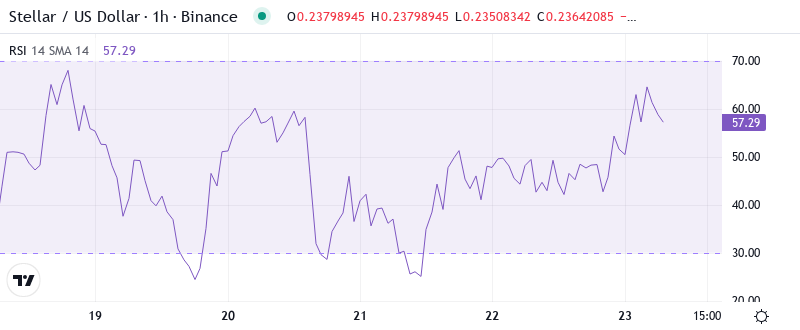
The relative strength index (RSI) in the daily time frame stands at 44.23, which means momentum is right in the middle with the recent drop from the December high. This neutral reading indicates that the bulls and bears do not yet give up – there haven’t been any capiatulation signals from the sell-off so far. So far, XLM’s RSI in the low 40s has led to a strong recovery in the past. However, this happened before an important support collapse, and breached this level could trigger additional sales.
A 15% rebound could be a good thing and is still possible to take advantage of. In October XRP did this and more as price surged 30% in a couple of days and then went mostly sideways which is something XRP does often even during uptrends. Buyer interest isn’t that high and not enough buyers to create a profit for sellers.
ADX at 48.4 Confirms Mature Downtrend in Progress
With the ADX line still pointing up, the coin remains under serious threat of further bearish action, which could prompt a test of the 2018 trough around $0.1750. If, instead, positive crossover takes place and a jump above the 44.35 barrier occurs, the bulls will likely try to overcome the falling 200-day SMA, currently at $0.2484. Reclaiming this level, they would probably encounter the $0.30 number again.
In other words, the ADX suggests we’re in a trending phase that’s conducive to shorts for day traders, rather than a choppy, range-bound market like we saw most of November. In practical terms, that means adjusting to current conditions – for now, fading rallies is the higher-probability trade until the ADX gets back below 25. The looming launch of Coinbase futures could be a potential trend-change trigger, but for now, the bears are clearly in charge if this metric is anything to go by.
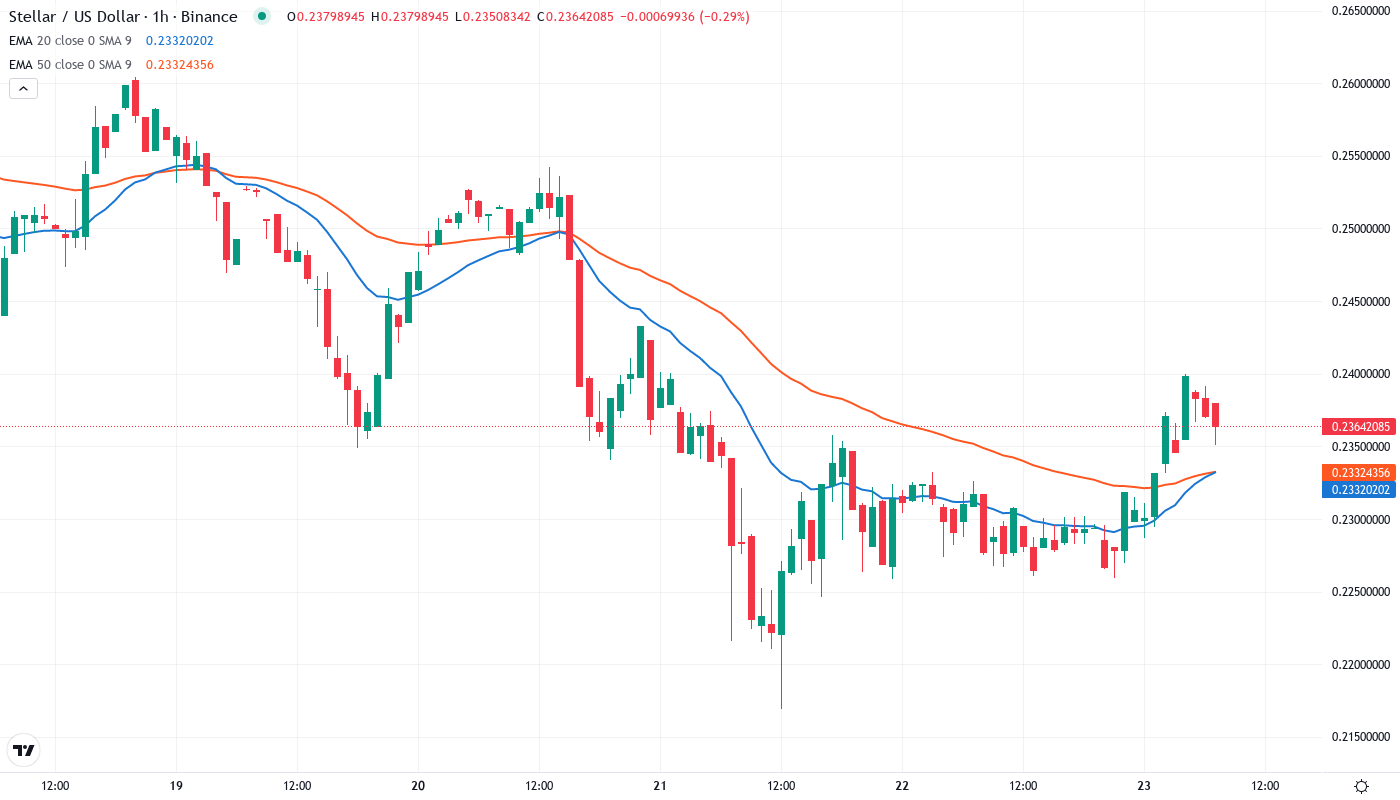
20-Day EMA at $0.261 Caps Recovery Attempts
The daily RSI consolidated around 50 but is beginning to trend down, which should be a concern for bulls. The same could be said when looking at the MACD, as it frequently flirts with breaking down under 0 and crossing the signal line bearishly. Buyers bought last week’s dip off the 78.6% fib retracement level, which is where they scooped the year’s lows. If sellers take $0.2111, the year’s low, and in the process the 88.6% retracement, there’s a very good chance price heads to the March 2017 high.
On the broader structure, the 200-day EMA lingers far above at $0.326, approximately 38% over present values — indicating intermediate timeframes have now reached hugely oversold territory. The previous supported zone at $0.275 (50-day EMA) now morphs into a line in the sand for bears to protect on any upside reclaims. The current price versus the 10-day EMA at $0.246 is pinched in between, indicating a breakdown or oversold bounce is likely to materialize soon — this kind of tight compressing seldom extends beyond 48 hours.
Support at $0.217 Faces Sixth Test Since June
There’s strong support down to the $0.20–$0.22 region, so below $0.30 continued weakness should be bought back up. The trend is clearly up, so each successive sell-off gives buyers at lower levels confidence they’re accumulating at a discount.
The support architecture has more weight behind it following the series of successful defenses. The $0.217 zone has been retested for the sixth occasion since late June, rebounding rate on each occasion with rising volume – notably most recently during the late November washout. This zone is further elevated as the June swing low and fractionally above the -42% six-month performance low.
The market structure suggests that buyers remain in the game as long as $0.217 is maintained on any pullbacks. It’s akin to a descending triangle given the presence of that horizontal support – usually a bearish cue but the repeated rejections off the level combined with the ISO 20022 migration event warrants a bit of caution on the bearish breakdown narrative. Should $0.217 give out, limited friction exists on the trip toward $0.177 (the yearly low) as there isn’t much in the way of historical volume.
Bulls Need Daily Close Above $0.275 to Shift Momentum
Buyers must attempt to defend key support near $0.25 which presently consists of the 78.6% retracement of the aforementioned downswing. Failing that, XRP/USD is vulnerable to a replay of the January 22nd low just under $0.23. As the oldest altcoin in the top ten, Ripple Labs’ token is trading near historical bottoms against Bitcoin and the USD; bottoms which, if seriously breached, may not be revisited for years.
The situation where bears take over is triggered by a breakdown of the $0.217 support accompanied by increased volume – the pattern of the descending triangle would then be confirmed, and the price target of the subsequent move would lie at $0.15. This breakout would catch new investors that had bought in on the ISO 20022 hype and would probably result in panic selling reaching this year’s minimum. Keep an eye on the daily candle closing below $0.214 as a specific break-through signal.
We are likely to see an oversold bounce towards $0.261 due to how extreme the ADX has become and how far below the lower Bollinger Band we are. This is heightened by the fact that we are only slightly below the previous support area that broke down. However, the 50 EMA (on the 4-hour) has been acting as resistance for over a week and likely will continue to do so. This means that if we do get that oversold bounce up to $0.261 this will continue the pattern of each consecutive bounce peaking lower than the last. This means if/when $0.261 is reached we would expect it to get sold into and likely come back down to test the support at $0.217 (which would paint a textbook descending channel in this consolidation range). Support has yet to be broken and resistance has yet to be reclaimed so it is going to take one breaking or the other for the next meaningful direction to be decided.