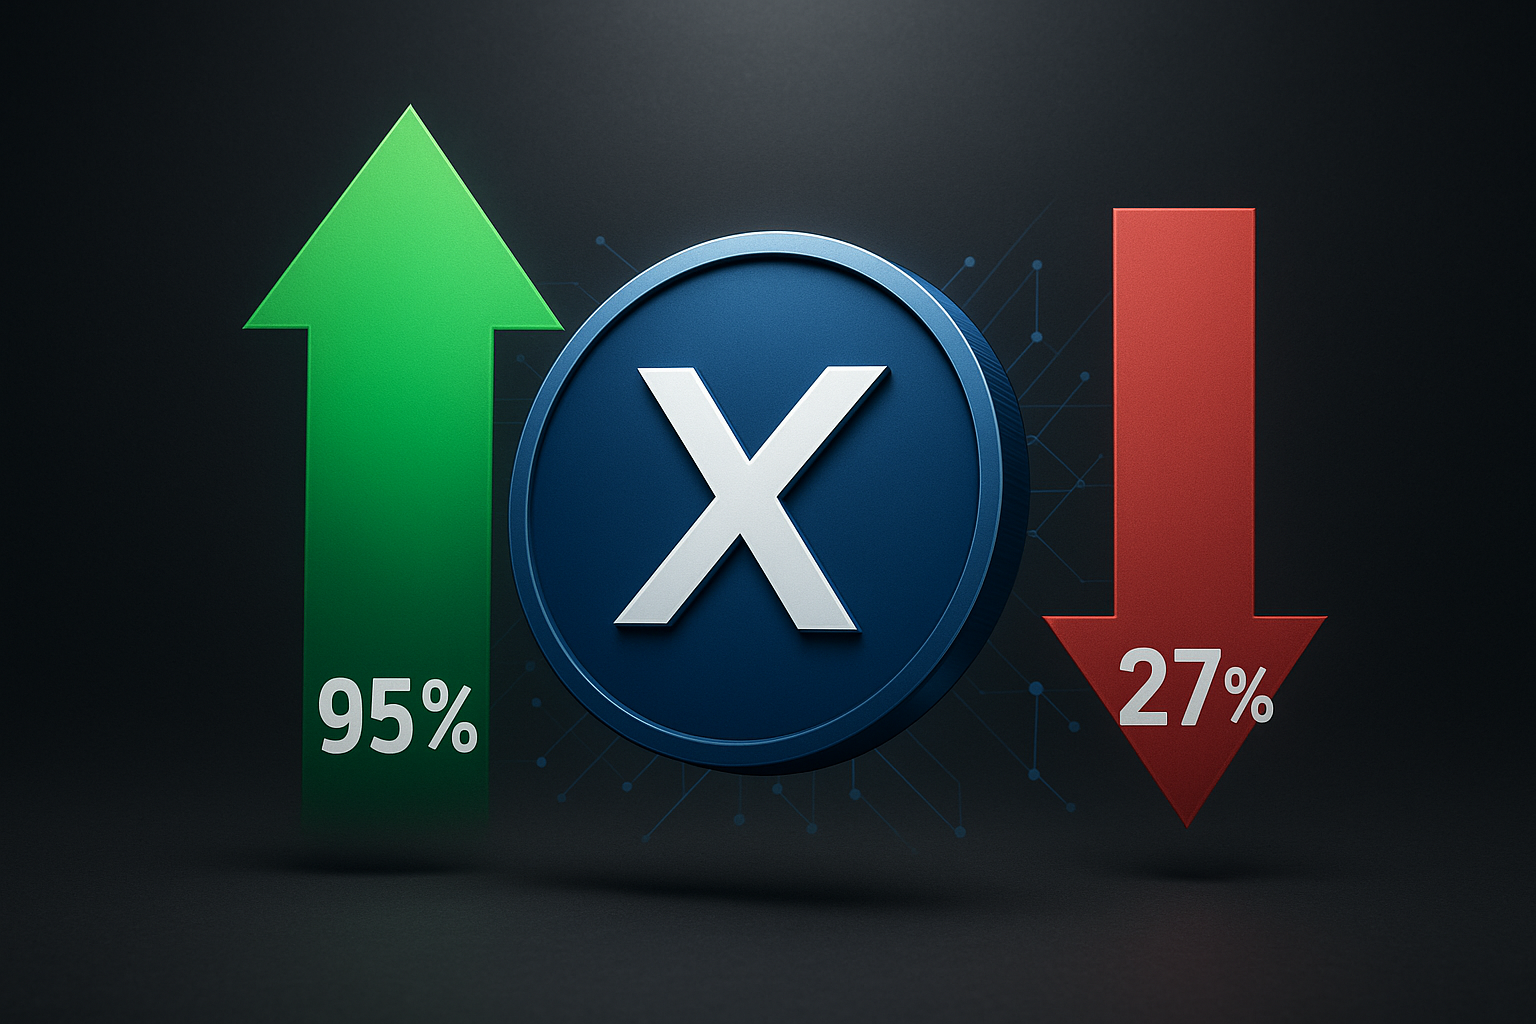
XDC Network Defies Gravity as Enterprise Blockchain Surges 95% in Users Despite -27% Price Drop
Market Structure Shifts Higher
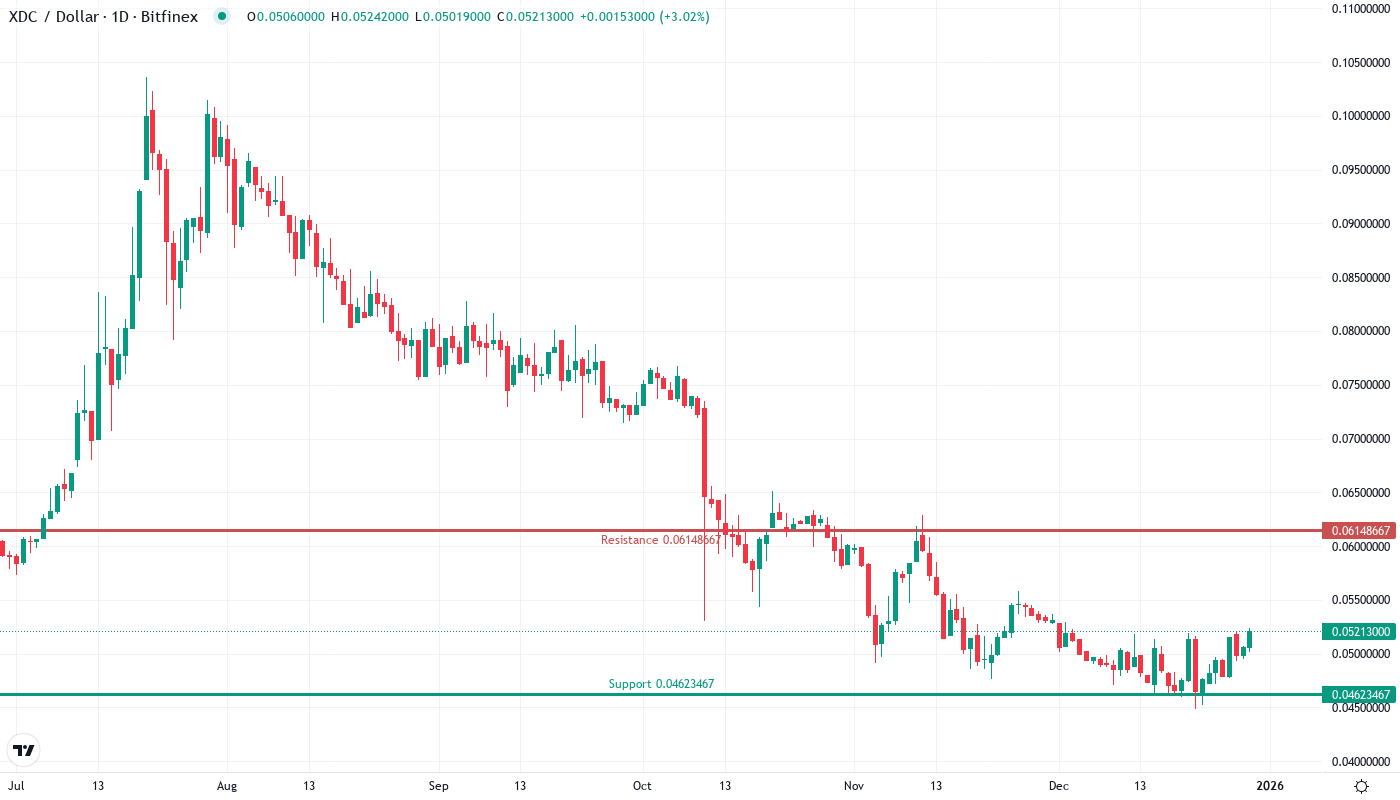
- The price of XDC is $0.052 at the time of writing, representing a 27% decrease over the past month.
- The network experiences a surge in user adoption with a 95% increase.
- The RSI has gone up from the oversold conditions, reaching 55.17.
This number mirrors the configuration seen before the rally in September. The support level at $0.0495 has been examined six times since June and is still pronounced with $717 million in RWAs gathering on-chain.
XDC Network has lost 27.9% over the last month, crashing from December peaks of almost $0.0537 to roughly $0.052 as of now. The painful descent occurred despite phenomenal on-chain expansion – the business blockchain saw a 95% rise in users and $717 million in institutional RWAs swarming the network in defiance of bear market woes. The key query for investors remains: will positive performance result in recovery, or will a weak technical background pull the altcoin lower even as demand soars?
| Metric | Value |
|---|---|
| Asset | XDC NETWORK (XDC) |
| Current Price | $0.05 |
| Weekly Performance | 12.82% |
| Monthly Performance | -2.56% |
| RSI (Relative Strength Index) | 55.2 |
| ADX (Average Directional Index) | 20.3 |
| MACD (MACD Level) | 0.00 |
| CCI (Commodity Channel Index, 20-period) | 159.23 |
Momentum Rebounds From Oversold as Network Activity Explodes
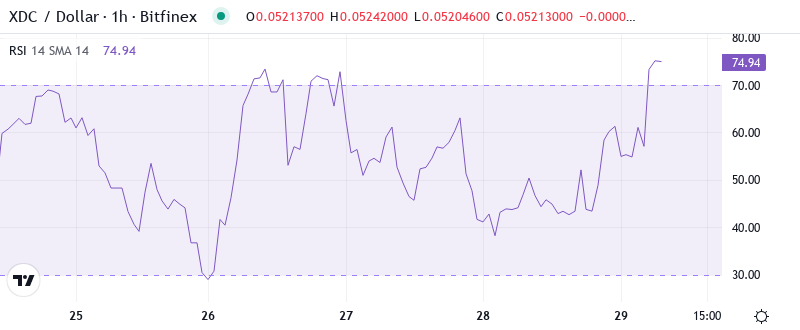
The Relative Strength Index (RSI) is at 55.17 on the daily timeframe. It has been rising from oversold levels below 40 over the past few days. This momentum recovery is akin to what was witnessed in September, where similar RSI structures on the charts were followed by a 40% rally in price. However, these technical setups were missing a real substance, fuel or catalyst as opposed to this current setup. This time, actual network growth and USDC issuance on the XDC Network is the fuel and what was missing the last time around.
An interesting fact is that the weekly RSI reads 38.92, which is still considered oversold, based on the weekly timeframe, the broader trend exhaustion hasn’t fully reset yet, but the daily timeframe shows a bullish momentum already. Therefore, swing traders can benefit from a neutral daily RSI paired with an oversold weekly RSI which provides an asymmetric risk-reward setup that slightly favors longs, given the institutional RWAs provide a fundamental underpinning.
ADX at 20.32 Signals Consolidation Phase Ending as Volume Returns
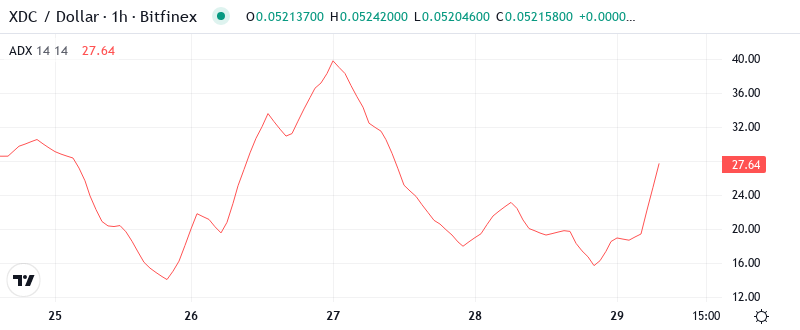
With ADX currently at 20.32, it signals that XDC is emerging from the directionless chop that characterized December. This zone represents a shift from range-bound conditions in which neither bulls nor bears had command of price action to the beginning of a new trend. The substantial increase in Circle’s CCTP flows over XDC Network fits this technical storyline of moving from consolidation to trending dynamics.
Just to make things clear, the ADX rising from the mid-teens indicates that volatility expansion is looming large following weeks of volatility contraction. A similar ADX reading back in November preceded XDC’s last meaningful trend move, and to the downside that time. So, be prepared for more volatile trading as the coiling pattern ultimately gives way, with the 95% user growth data possibly acting as a spark for an upside resolution on this occasion.
20-Day EMA at $0.0497 Becomes Critical Support After Three Rejection Attempts
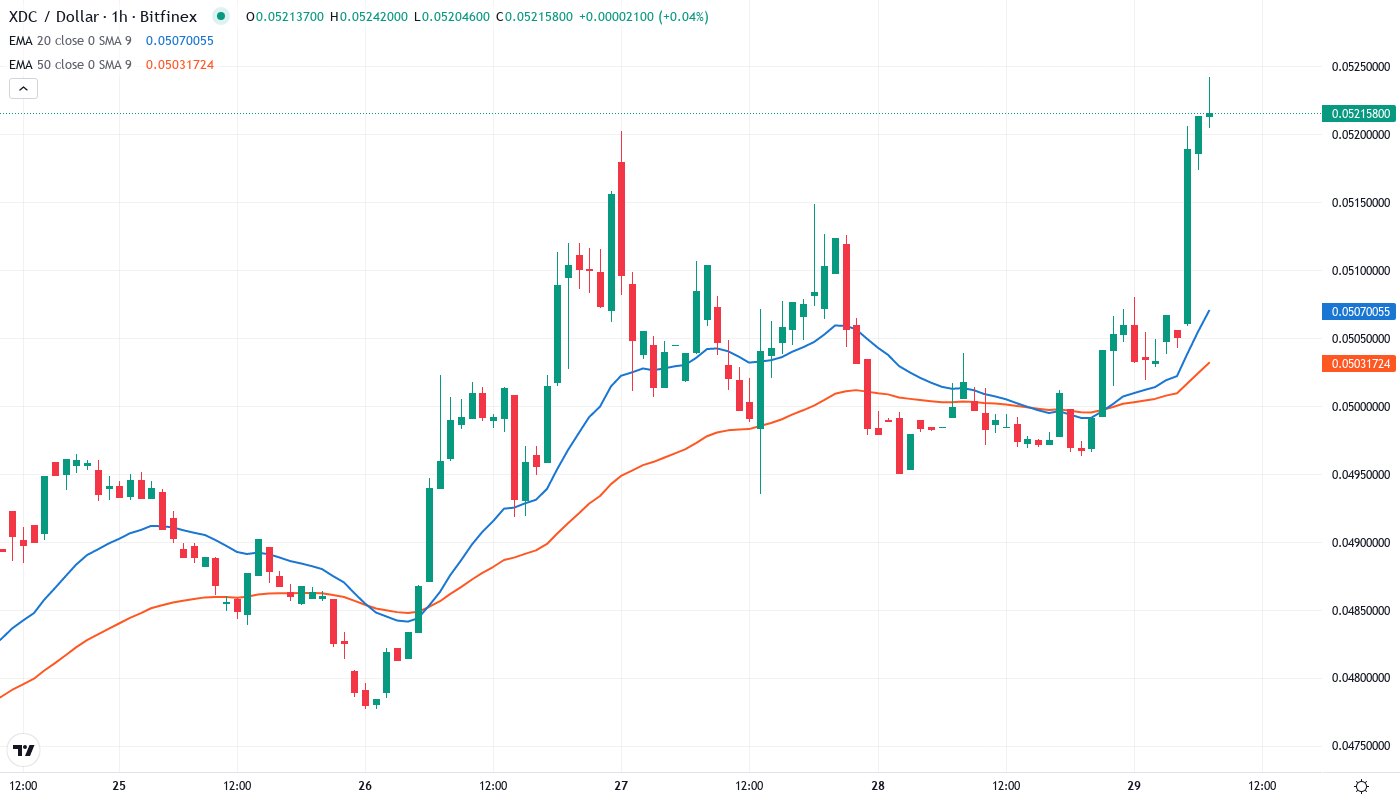
The subsequent 20-day convergence under the 10-day EMA, followed by both EMAs joining back under the 50-day EMA, formed an EMA Golden Cross for the first time since the week of August 8. This potentially bullish development reversed unhealthy price excesses, resulting from 4 of the last 5 daily close violative of the upper Bollinger Band.
The most important takeaway from yesterday’s article was the virtual compression occurring between the 20-day and 50-day EMAs. At just $0.0023, that gap looks/feels like a coiled spring, one that could lead to significant upside momentum when/if the more short-term EMA rolls it’s way over the flatter, slightly longer EMA. If $0.0520 Resistance goes and the 20-day EMA pushes the price over the 50-day EMA, those would be your first clues; the 100-day EMA will be overhead at approximately $0.0573.
Support at $0.0495 Tested Six Times Becomes Foundation for Recovery
The closest resistance clusters in the XDC/USD pair are seen between $0.0520 and the psychologically significant handle at $0.0550, a zone that invited solid selling in December. Further north, the monthly peak at $0.0537 and the 100-day EMA at $0.0573 could limit advances. This area has defined the bull/bear pivot over the past month, with rallies consistently capped around the lower band of this hurdle. The latest uptick faltered right on cue, warning of a potential downturn.
Buyers are currently defending an uptrend line that started in September. Bulls predict another uptrend line starting when this structure is ultimately compromised though it’s unclear if both levels would intersect at the key $0.0462 to $0.0495 zone. Icon made a minor invalid break by touching as low as $0.0442 earlier this week but, undoubtedly, there are many stop losses at that location waiting to be hunted in the likely event of a trend reversal.
Importantly, the market structure indicates consolidation trends as price forms higher lows above $0.0495 while on-chain metrics surge. The separation between underlying expansion (95% influx of users, $717M exposure) and price performance (-27% in month) generates a slingshot effect that normally ends dramatically in either direction. Volume trends indicate savvy money flows in silently while this push’n’pull happens.
Bulls Need Decisive Close Above $0.0520 to Confirm Trend Reversal
If the price reclaims the 50-day EMA at $0.0520 with a surge in volume, we anticipate bulls to confront resistance at initial $0.0573, while the $0.060 level could be tested if the USDC demand expansion gathers further pace on XDC. Each new RWA deployment news reinforces confidence in the enterprise blockchain story, opening doors for a meaningful pullback should the technicals comply.
If the support level at $0.0495 is broken, this means that those who recently invested in the belief in network fundamentals will be at a loss and the price will most likely drop to $0.0448 or even lower. If the price fails to break the $0.0520 resistance level after several attempts, this indicates that the asset is being distributed even though fundamentals are positive. Therefore, more losses can be expected, independent of measures of adoption.
Due to the technical compression, oversold weekly conditions, and explosive fundamental growth divergent to price, the highest probability near-term path has XDC consolidating between $0.0495-$0.0520 before institutional RWA flows act as the launchpad for a breakout attempt. The 95% user growth amidst market weakness positions XDC uniquely post technical resistance clearance.