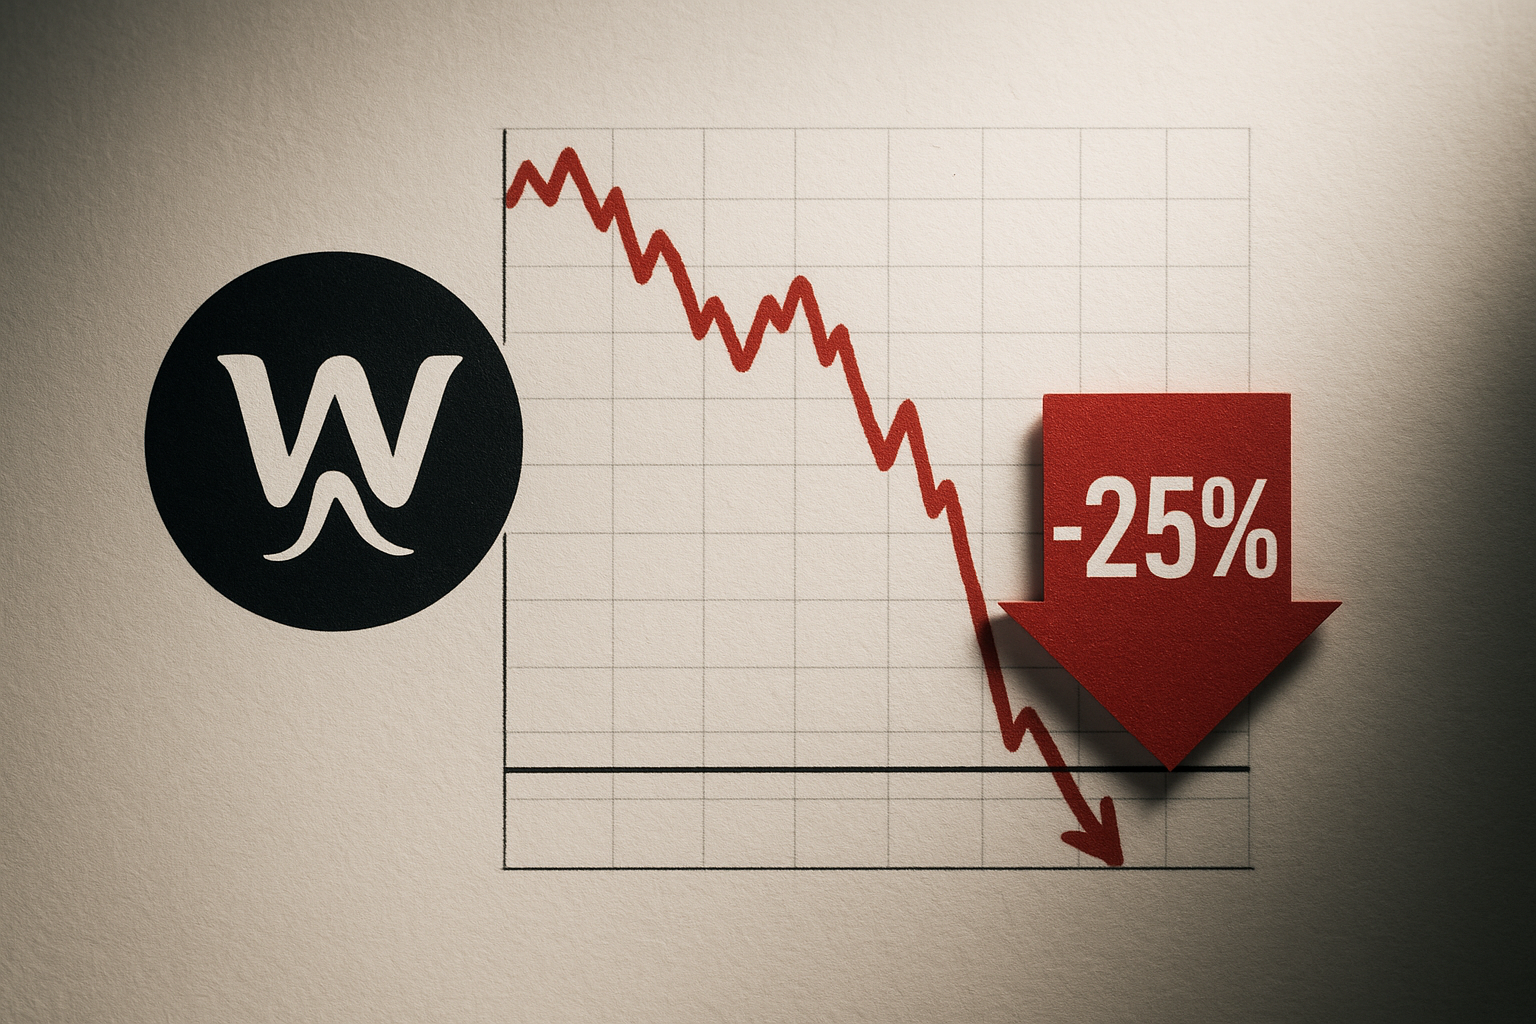
Walrus Tests Critical Support as Mainnet Launch Funding Fails to Stem 25% Monthly Slide
Market Structure Shifts Lower
- Partnership with LINE
- Announcement of specifics for the Waldo IDO by end of Q1
- Deals with 1-2 NFT artists around the airdrop
Despite securing $140M in mainnet financing, the WAL token dropped by 25.16% in April, falling to as low as $0.116 before entering May. With the arrival of May, we aim to share the latest project updates and token…
Despite the heavy rejection from flagship altcoins and Bitcoin seeding fears of below 10k again, likely catalysts in the Walrus camp that could drive a turnaround include the LINE partnership/announcement of specifics for the Waldo IDO by end of Q1 at the latest/deals with 1-2 NFT artists around the airdrop. Buy-ins for such catalysts could be good opportunities while others may wait for further downside. Two of the three catalysts just aren’t that far off, and today’s sunk cost can become tomorrow’s realized gain.
| Metric | Value |
|---|---|
| Asset | WALRUS (WAL) |
| Current Price | $0.12 |
| Weekly Performance | -4.58% |
| Monthly Performance | -25.16% |
| RSI (Relative Strength Index) | 34.8 |
| ADX (Average Directional Index) | 45.2 |
| MACD (MACD Level) | -0.01 |
| CCI (Commodity Channel Index, 20-period) | -62.54 |
RSI at 34.82 Signals First Oversold Reading Since Launch
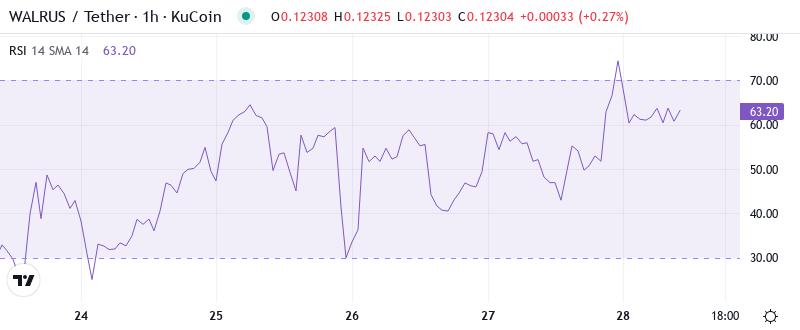
The oscillator reading of 34.82 on the daily time frame shows that traders are seeing WAL as oversold for the first time since its inception. Momentum exhaustion at this level of capitulation often indicates areas where the impact of sales diminishes, but in new tokens like WAL, oversold conditions can be more lasting than in property assets. The weekly RSI of 30.05 supports this oversold story, signaling that sales have been made over several frames.
What is notable though is how RSI responded to the $140M raise news, basically doing nothing and remaining at oversold levels, meaning that news or not, sellers dominated the price action. The same RSI setup could be found on the other Sui ecosystem tokens in recent weeks and the related relief rallies reached 30-40%, giving you an idea of what’s possible if market structure allows it. However, some of those tokens had relatively normal and calm trading weeks behind them and WAL is different in that regard. For a swing trader, an RSI this oversold is a high-risk high-reward setup and any kind of positive news could trigger a violent move.
ADX at 45.23 Confirms Mature Downtrend Nearing Exhaustion
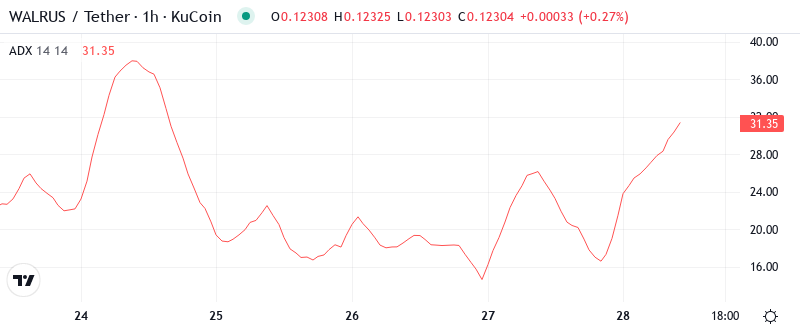
Based on ADX rules, stay with a short bias for now and look to go long only after the uptrend has had a chance to play out and likely establish more reliable support (price recovery) and resistance (where the sellers return in large numbers). It’s obviously too soon to start looking for a sustained long play.
Analyzing the ADX components, the -DI at 30.51 is still higher than the +DI at 9.29. This suggests that bearish control is maintained. In other words, the ADX is suggesting that we are late in a trending move, and momentum traders need to start preparing for the chance of ranging conditions. This means that day traders need to adapt their strategies from trend-following to mean reversion, particularly with oversold RSI and extreme ADX double whammy in effect.
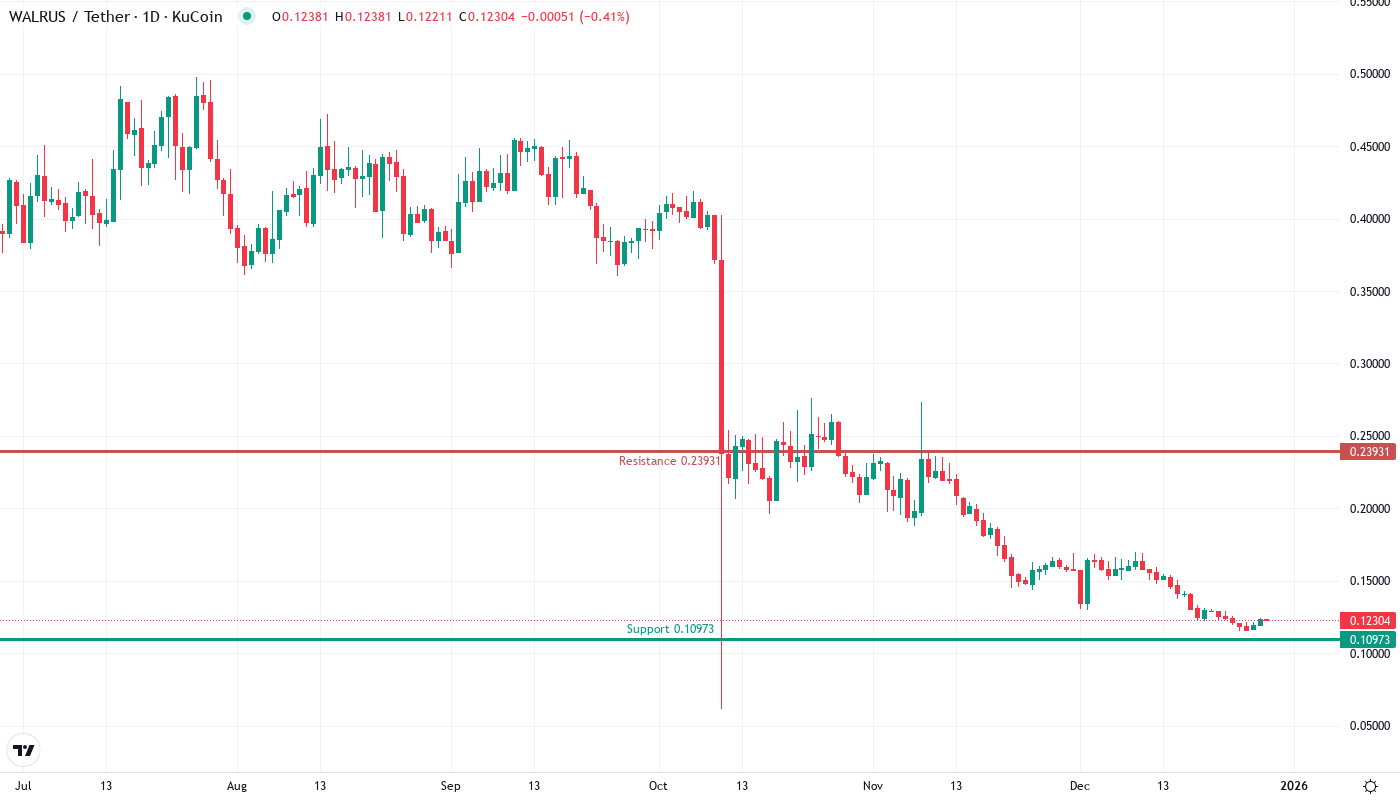
Price Trapped Below Entire EMA Cloud Since December Highs
The price now hovers just above the flat 200-day EMA at $.117. Should that give way to selling pressure, sellers may find a solid bid at long-term support near $.100. Reclaiming the yearly pivot at $.130 is Wondershare AllMyTube Buy Signal.
After the mainnet funding news broke, the price made two attempts to climb back above the 10-day EMA but encountered heavy selling pressure. The fact that this rebound failure occurred in the face of bullish news indicates that institutional investors selling their positions or a larger flight from risk in the Sui ecosystem is stronger than any positive project-based news. The 100-day EMA at $0.220 is currently 78% above the market – one of the biggest untested moving average gaps we have. To even begin thinking about a market structure change, the bulls have to close $0.143 above the daily.
$0.116 Support Holds Despite Six Tests – Bulls’ Last Stand
Under these circumstances, I would look for a couple of consecutive closes above the $0.15-0.152 resistance zone to confirm a local bottom has been established and the price is ready to push back above $0.20. A successful break above this resistance level would likely gain momentum as recent short-term long positions were caught on the wrong side and would undoubtedly close upon a move back above this resistance level. Hence, a move back above $0.20 could come rather quickly once these shorts are cleared out.
There is a strong resistance in the range of $0.133 (10-day EMA) and $0.143 (20-day EMA), and the psychologically important level of $0.150 also serves as resistance. If the price rebounds, the above-mentioned resistance zone will likely act as a strong barrier. Buyers will find it hard to scale this resistance zone.
The current market structure continues to be overwhelmingly bearish as long as the .618 at 0.143 holds as resistance. Price was able to remain above the 200MA/D as well as our structural support level around 0.116. The overall market has still been stuck in this multi-week downtrend now.
Relief Rally to $0.143 Most Probable Near-Term Path
Bulls need a clear close above $0.133 to justify any relief rally in the first place. If that happens, this move will be measured to $0.143-0.150 region, where the 20-day EMA will meet psychological resistance. The Sui ecosystem developments are mainly lined up in the coming days/weeks and if Michael van de Poppe is correct, this could be the narrative-driven catalyst bulls need, to push for such a relief rally in the first place given how oversold we are.
If the support at $0.116 fails, bearish acceleration could lead to increased selling pressure and trigger further stop-losses, with the price dropping to the psychological level of $0.10. This would represent a 40% decrease from the highs of December. This drastic drop could trap investors who bought into the recent hype surrounding the mainnet funding and could indicate a long-term bottom after investors feel maximum discomfort.
Technical indicators have reached oversold conditions, which often suggests that an upward price correction could be on the cards. While the market has dipped below multiple long-term support areas, these losses were typically recouped within days. Additionally, the pending funding rate, along with the recent positive news, seems to indicate that a surge has potential. We would like to caution that in a volatile environment like we are currently in, general market risk is high.