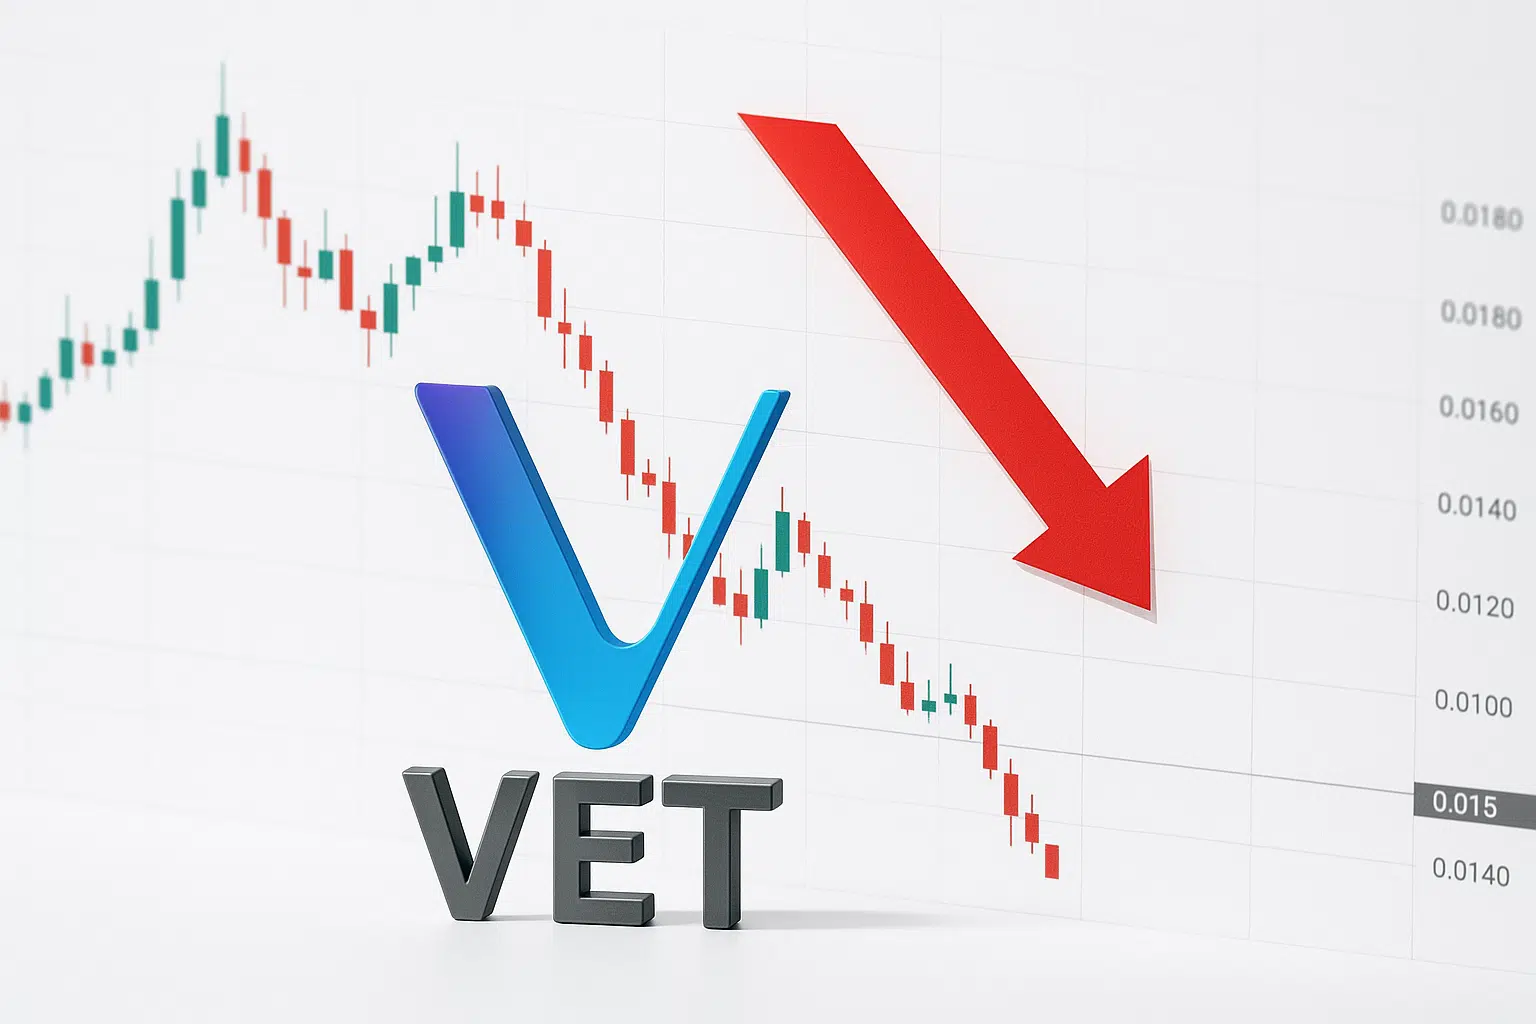
VeChain Tests Critical Support at $0.015 as Bears Press Monthly Lows
Market Pulse
- VeChain shed more than 13% over the last seven days as sellers were relentless taking profit after the early-September surge.
- VET price is approaching the lower trend line of an ascending parallel channel which has contained the token since the capitulation event in July and the fear markets in August.
- The latest drop eliminated around 18% of December’s top, casting doubt on the resilience of the much-hyped double-bottom pattern.
VeChain shed more than 13% over the last seven days as sellers were relentless taking profit after the early-September surge. VET price is approaching the lower trend line of an ascending parallel channel which has contained the token since the capitulation event in July and the fear markets in August.
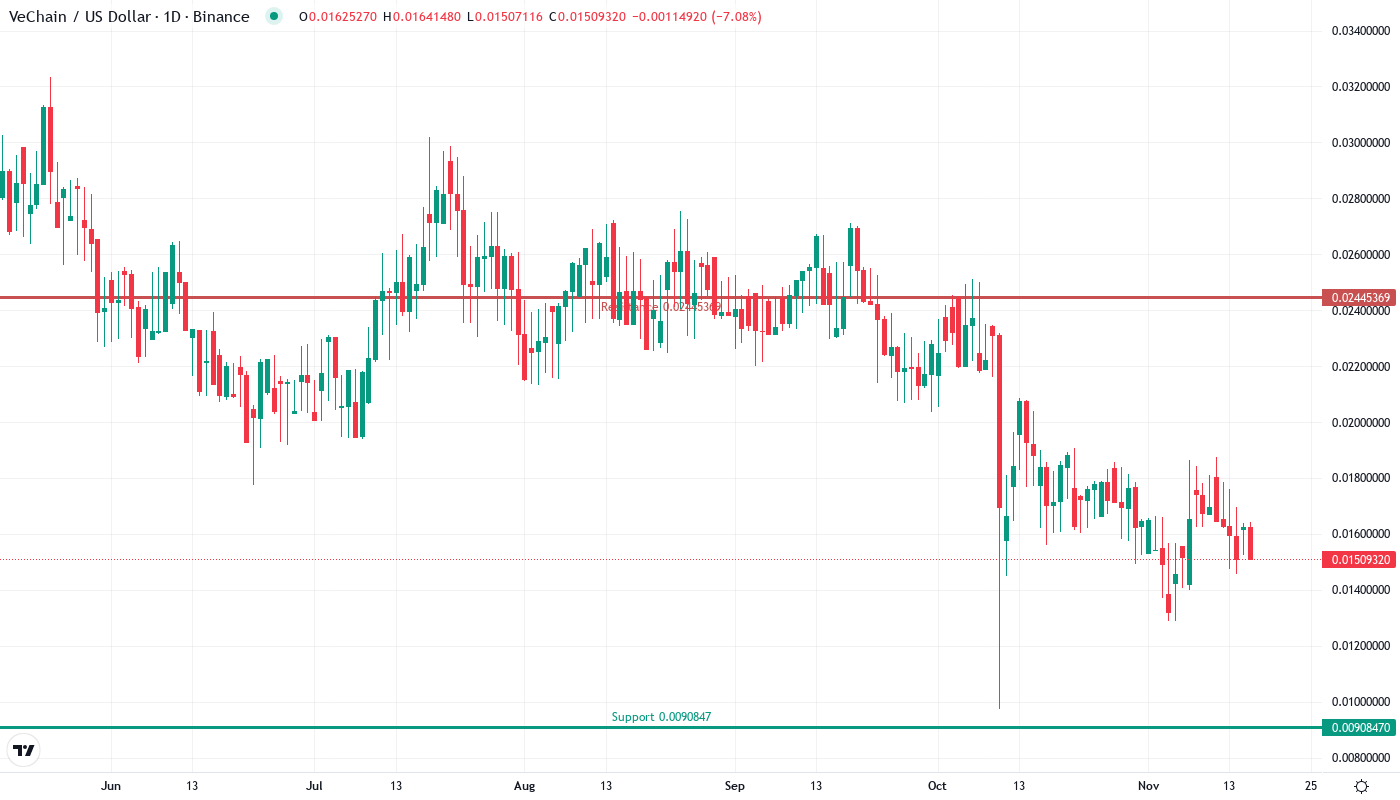
VeChain continued its relentless slide this week, with VET losing 13.4% to trade at $0.0151 – perilously close to testing its monthly low of $0.0129. This devastating drop eliminated around 18% of December’s top, which has many traders doubting if the much-hyped double-bottom pattern will hold. The question for traders is – will the $0.015 psychological level be enough to support a relief bounce? Or are we destined to test the annual lows in full?
| Metric | Value |
|---|---|
| Asset | VECHAIN (VET) |
| Current Price | $0.02 |
| Weekly Performance | -13.36% |
| Monthly Performance | -18.07% |
| RSI (Relative Strength Index) | 42.2 |
| ADX (Average Directional Index) | 29.8 |
| MACD (MACD Level) | 0.00 |
| CCI (Commodity Channel Index, 20-period) | -50.34 |
RSI Drops to 42.16 – First Oversold Territory Since October
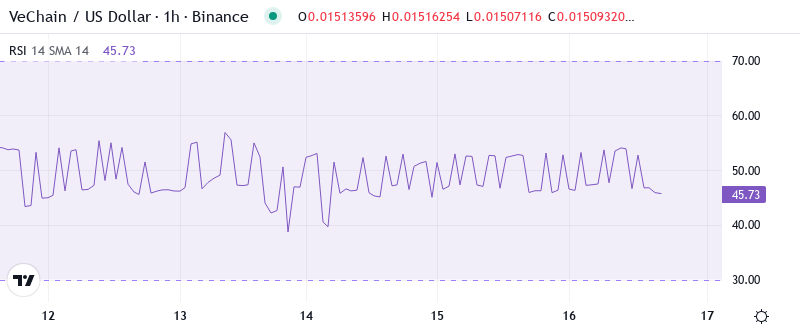
With the oscillator reading at 42.16, momentum is nearing oversold levels for the first time in almost three months. The RSI hasn’t reached these depressed levels since October’s low wash, with comments triggering a 35% rebound with similar readings. As it turned out, RSI didn’t really push with speculation of recent weekly pattern Bulls peaking at 47.5, making it clear that they never really grip the momentum reins.
For swing traders, this balanced-to-bearish RSI configuration suggests we’re entering a critical decision zone. The monthly RSI at 41.13 reinforces the intermediate-term weakness, though it’s worth mentioning that extreme oversold readings below 30 often mark capitulation bottoms. Technical analysts citing the double-bottom formation need to see RSI reclaim 50 with conviction – otherwise, the pattern lacks the momentum fuel for a sustainable reversal.
ADX at 29.83 Confirms Bears Control the Trend
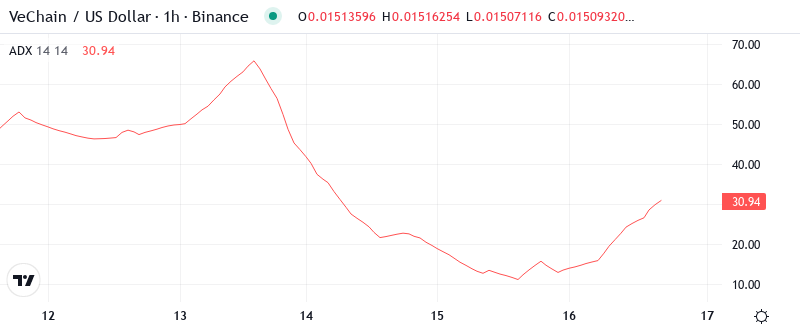
Indicators of trend strength give a good indication of what is happening, with ADX rising to 29.83, showing real directional movement after some weeks of choppy consolidation. The ADX is an entry at this level, telling us that we have shifted from conditions in a range to the markets – unfortunately for the trend and bulls, this is clearly descending. The surge from the mid-20s is actually the strongest trend conditions that VeChain has suffered since November’s decline.
In simple terms, between 25 and 40 ADX indicates the trend is strong, meaning the market is insisting on moving in one direction. At the same time, there are enough players stuck in the wrong position due to the chop to fuel several more days of that trend. People who were attempting to bottom-tick the chop might be strongly inclined to sell to avoid losses knowing they were wrong. This selling gives fuel to the trend and keeps it going.
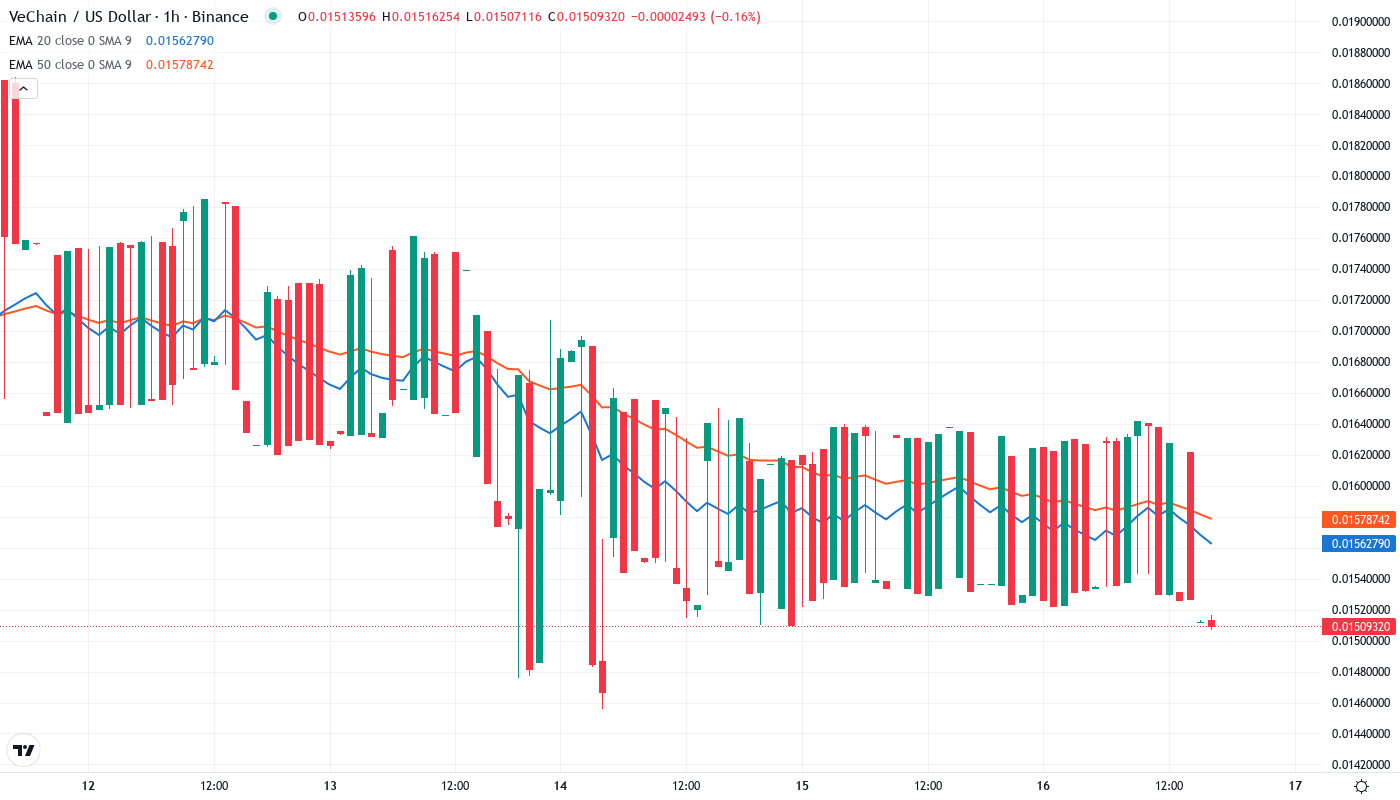
20-Day EMA at $0.0163 Caps Recovery Attempts
The lack of support below means VET could easily revisit lows not seen since October 2019. The next crucial level is the 88.6% retracement at $0.0139. If that fails (and given the overhanging EMAs there isn’t much to suggest it will hold), swing low at $0.0098 will almost certainly be retested.
What matters is the squeeze between the 10-day and 20-day EMAs, which typically occurs before violent action. The 50-day EMA has flipped from being a support to a resistance after December’s failure, and this has rejected bids twice over the past week. That previous support zone at $0.0169 now turns into a resistance for the bears to guard, particularly because the breakout is still not getting legs despite the setup.
$0.015 Support Faces Sixth Test Since June – Critical Line in Sand
The very first level of resistance is the week high at $0.0167. If this level is eventually breached, the $0.018-$0.02 region will confirm as the next resistance due to the week’s low and the monthly pivot. Should that level give way as well, the $0.023 to $0.025 area will serve as the primary resistance zone.
There is strong resistance above, beginning with the 10-day EMA at $0.0159 and the 20-day at $0.0163. The monthly pivot point at $0.0171 is in close proximity to the 50-day EMA at $0.0169, forming a strong resistance zone that would have to be breached before any potential bullish reversal could be taken seriously. The double-bottom pattern that everyone is talking about is completely negated if the daily chart closes below $0.0147.
Importantly, the market structure indicates seller control as long as VET stays under the $0.0163 mark. The setup analysts pinpointed needs momentum to change, not just a hold of the support, and that has not been the case with the current technical state. As indicated by the volume, at 46% average, based on the suggestion score, neither bulls nor bears have been particularly confident either.
Bulls Need Decisive Close Above $0.0163 to Validate Pattern
Buyers need to gather themselves, reach a definitive consensus to protect the recent low at $0.0156, and provide the capital necessary to transform this EMA back into support. We’re in a tight range right now, so trading this high may be too risky until the range expands and the next moves are clearly marked.
If sellers really want to take control, you will see a volume spike when the bears take out $0.0147. From there, the focus will be on the $0.0129 monthly low and the $0.0110 annual support.
Based on the technical setup and the fact that there isn’t much positive price action in sight, it seems likely that VET will test the aforementioned support zone and possibly even break below it in the coming days. The lack of any major resistance levels in this region implies that a pullback towards the $0.013-$0.0125 area is entirely feasible.