UNUS SED LEO Consolidates Near $9 as ADX Signals Trend Building From Extended Chop
Market Structure Shifts Higher
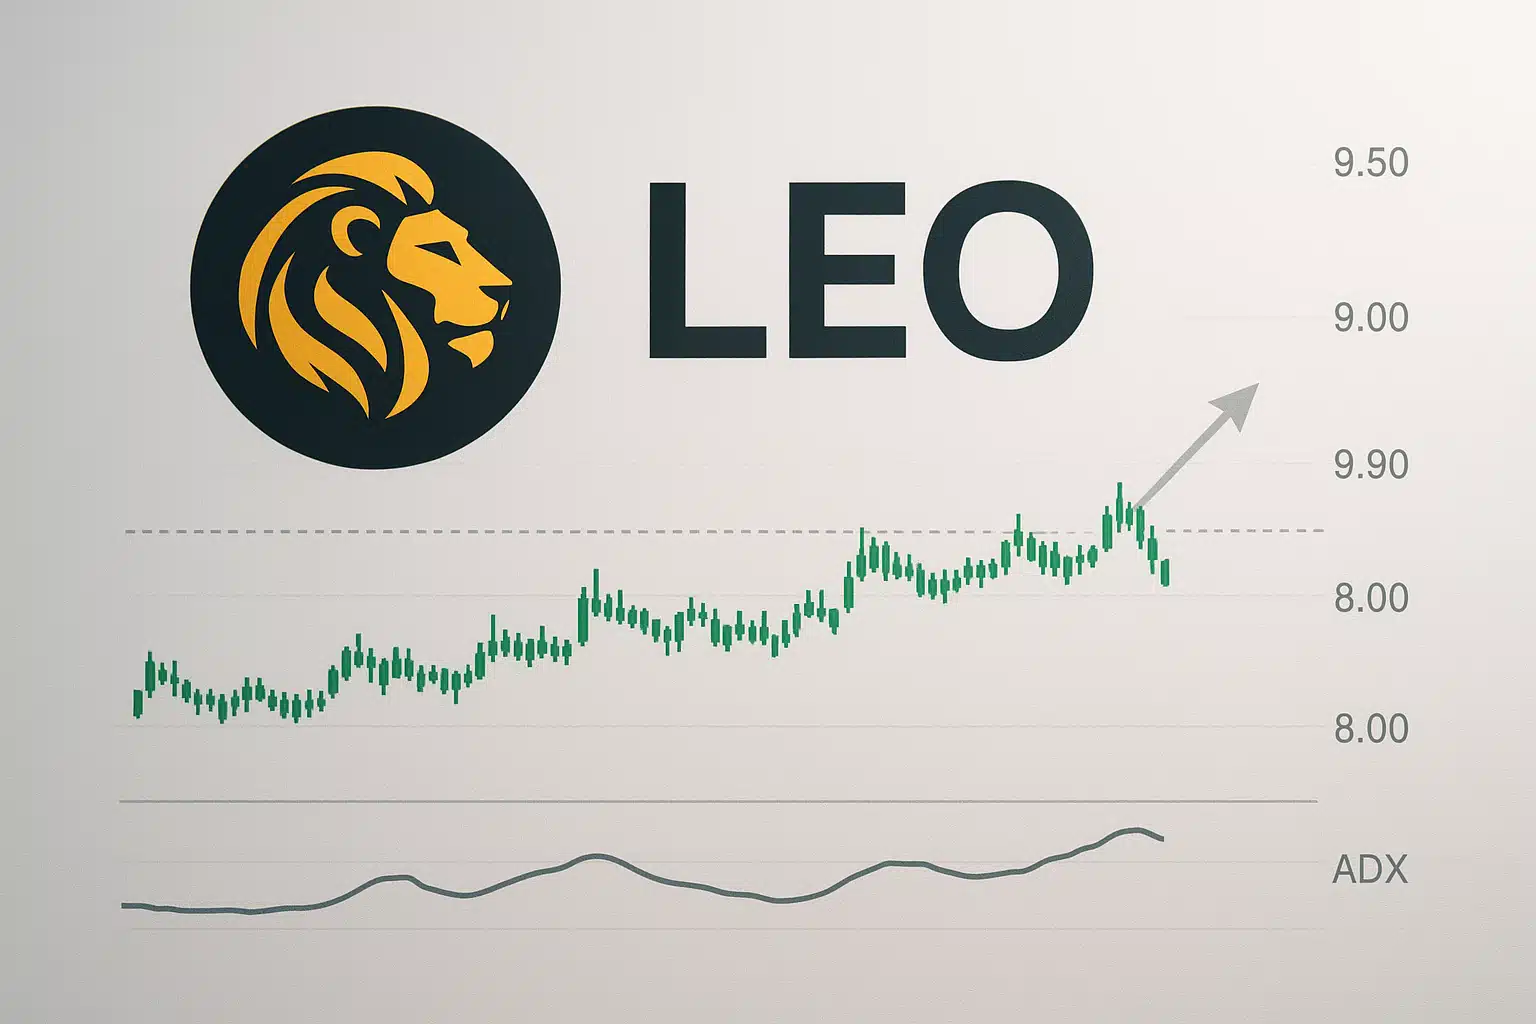
- LEO trades at $8.97, recovering from monthly low of $8.63 despite broader market weakness
- ADX climbs to 37 from sub-20 readings, marking shift from consolidation to trending conditions
- Price action respects 50-day EMA at $9.34 as resistance while building higher lows above $8.63

UNUS SED LEO has carved out a defensive posture this week, holding $8.97 while posting a modest 0.73% gain over six months – a period where most altcoins bled significantly. The token bounced convincingly from its monthly low of $8.63, establishing what appears to be a higher low in an emerging uptrend structure. The main question for traders is: can LEO break above the 50-day EMA resistance at $9.34 to confirm this bottoming pattern, or will sellers defend that level for a fourth consecutive attempt?
| Metric | Value |
|---|---|
| Asset | UNUS SED LEO (LEO) |
| Current Price | $8.97 |
| Weekly Performance | -5.91% |
| Monthly Performance | -7.15% |
| RSI (Relative Strength Index) | 41.1 |
| ADX (Average Directional Index) | 37.0 |
| MACD (MACD Level) | -0.08 |
| CCI (Commodity Channel Index, 20-period) | -79.21 |
RSI at 52.75 Reflects Balanced Momentum After December Reset
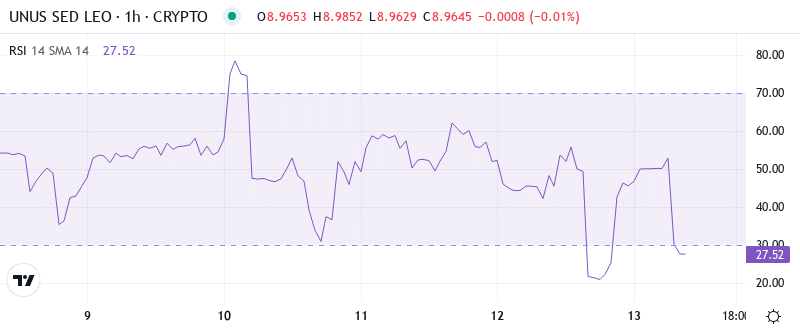
Reading the oscillator at 52.75 on the daily timeframe reveals perfectly neutral momentum – neither overbought nor oversold conditions plague the setup. This balanced reading follows a reset from overbought territory above 70 just weeks ago, giving bulls room to push higher without immediate exhaustion concerns. Historically, when LEO’s RSI stabilizes in the 50-55 zone after cooling from extremes, the token tends to consolidate briefly before choosing direction.
So for swing traders, this neutral momentum creates an ideal entry environment where risk-reward ratios favor patient positioning. The weekly RSI sits nearly identical at 52.64, confirming that multiple timeframes align in this balanced state. Previous instances of dual-timeframe RSI convergence near 52 preceded LEO’s most significant moves in both directions.
ADX Surge to 37 Marks End of Two-Month Sideways Grind
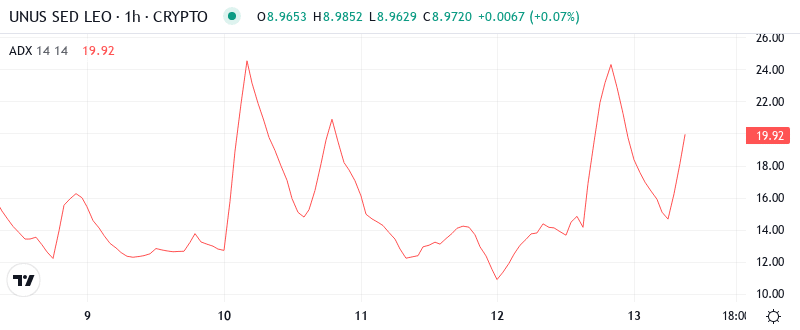
Trend strength has awakened dramatically with ADX rocketing to 37.03 from readings below 20 just days ago. This sharp acceleration signals that LEO is transitioning from a choppy, range-bound market into a trending environment where directional strategies outperform mean reversion trades. At current levels, the ADX indicates moderate-to-strong trend development without reaching the extreme readings above 40 that often mark exhaustion.
To clarify, when ADX jumps from compression below 20 to readings above 35, it typically marks the early stages of a sustained move rather than its conclusion. Day traders should adjust their approach accordingly – the market no longer rewards fade attempts at range extremes but instead favors momentum continuation plays. The velocity of this ADX expansion mirrors setups from previous LEO rallies that delivered 15-20% moves.
50-Day EMA at $9.34 Becomes The Line in The Sand
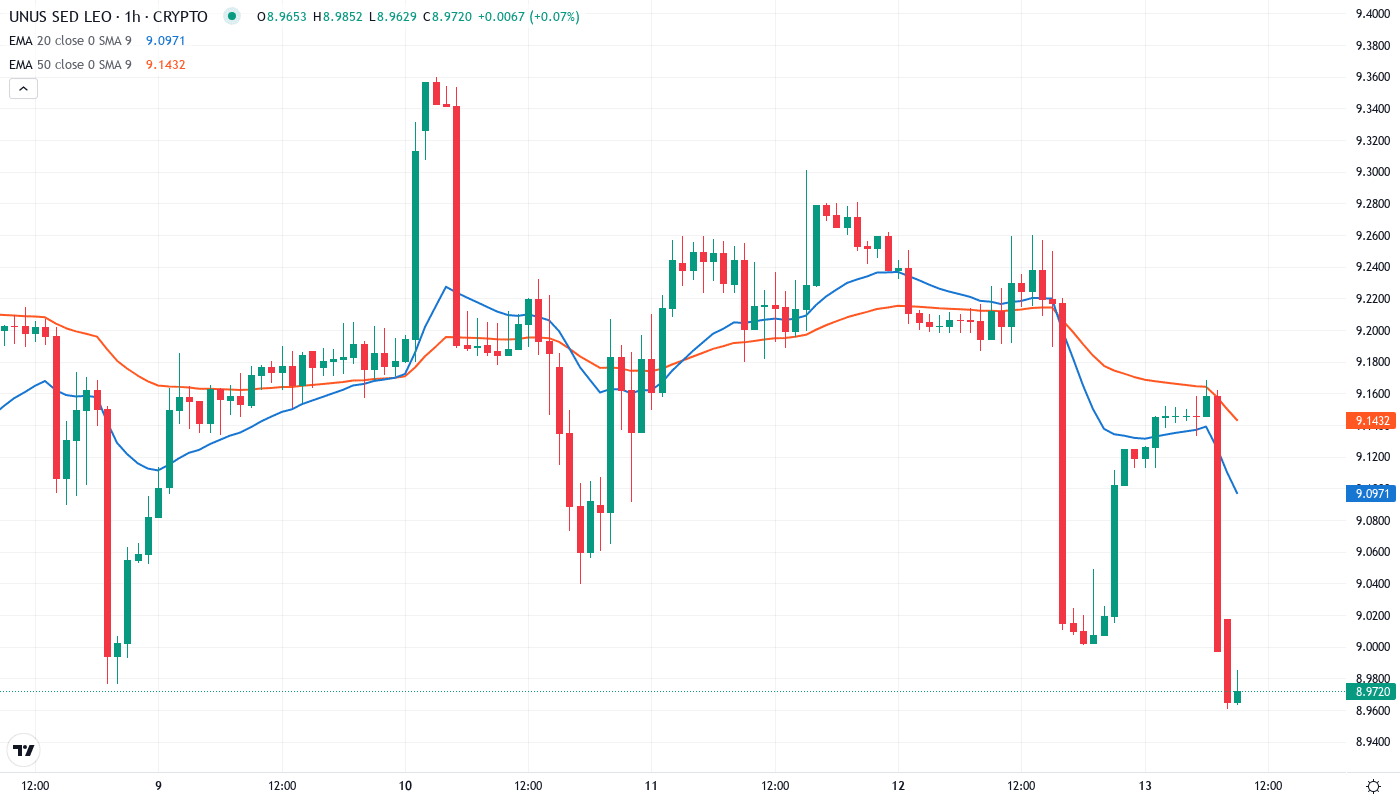
Price action tells a clear story through the EMA structure, with LEO currently trading below the crucial 50-day EMA at $9.34 but above both the 10-day ($9.17) and 20-day ($9.25) averages. This compression between short-term support and medium-term resistance creates a coiled spring formation that typically resolves with an explosive move. The 50-day EMA rejected advances three times in the past two weeks, establishing it as the key level bulls must conquer.
More telling is how price reclaimed the 10-day EMA after briefly losing it – a sign that buyers defend tactical support levels aggressively. The 100-day EMA sits distant at $9.35, essentially creating a double resistance zone with the 50-day that will require significant volume to breach. Should bulls manage a daily close above this $9.34-$9.35 resistance cluster, it would flip these averages from resistance to support and open the path toward the monthly high at $9.69.
Resistance Cluster at $9.34-$9.35 Guards The Upside
Above current price, sellers have fortified a formidable resistance zone where the 50-day and 100-day EMAs converge at $9.34-$9.35. This technical confluence has repelled three separate rally attempts, making it the most critical level on the chart. Beyond that lies the monthly pivot at $10.17 and the psychological $10 level – both representing significant overhead supply from trapped longs.
Support architecture looks more constructive with multiple layers protecting downside. The immediate floor sits at $8.81 where the monthly S1 pivot provides backing, followed by the recent low and psychological level at $8.63. This support held six separate tests over the past month, demonstrating genuine buying interest at these levels.
Market structure reveals an ascending triangle pattern forming, with horizontal resistance at $9.34-$9.35 meeting a rising trendline from the $8.63 lows. This classical continuation pattern targets a measured move to $10.05 upon breakout – almost perfectly aligned with the monthly pivot resistance.
Bulls Need Decisive Close Above $9.35 To Ignite Rally
For the bullish scenario to materialize, LEO must print a convincing daily close above the $9.35 resistance cluster with volume exceeding the 10-day average. Such a breakout would likely trigger stop-losses from shorts positioned at resistance, potentially accelerating the move toward $10.05 and eventually the $10.17 monthly pivot.
Bearish pressure reasserts if price fails at $9.34-$9.35 again and breaks below $8.81 support on volume. This would trap recent buyers and likely cascade into a retest of $8.63 – and potentially lower toward the monthly S2 at $7.83 where longer-term buyers typically emerge.
Given the ADX trend strength building and RSI maintaining neutral readings with room to run higher, the most probable near-term path sees LEO attempting another assault on $9.35 resistance within 48-72 hours. Whether this attempt succeeds depends largely on broader market conditions and LEO’s ability to sustain buying pressure above the clustering short-term EMAs.
