Uniswap Tests Critical Support After 42% Monthly Plunge as Blockchain Capital Exit Weighs on Sentiment
Market Pulse
- The Uniswap token has plummeted over 42.7% in March, shedding almost $3.2 from its December peak of $7.45.
- The relentless selloff intensified over the last week, putting even more pressure on UNI as it struggled to hold key support around $5.35.
- The unfavorable price action may have been aggravated by the withdrawal of 750,000 UNI by Blockchain Capital, which had an estimated value of $6.48 million at the time.
However, despite the massive losses incurred this month, the decentralized exchange token has only carved out a 4.5% decline since the turn of the year.
The native token of Uniswap has had a terrible month. In January, it fell 42.7% to $5.36. The fall intensified after Blockchain Capital pulled $6.48 million out of the system, giving a clear signal to small traders who were already losing money on the DeFi rout. The main question facing traders is whether the $5.30 region can remain the final bastion or whether the capitulation will push UNI to the psychological level of $5.
| Metric | Value |
|---|---|
| Asset | UNISWAP (UNI) |
| Current Price | $5.36 |
| Weekly Performance | -12.49% |
| Monthly Performance | -42.70% |
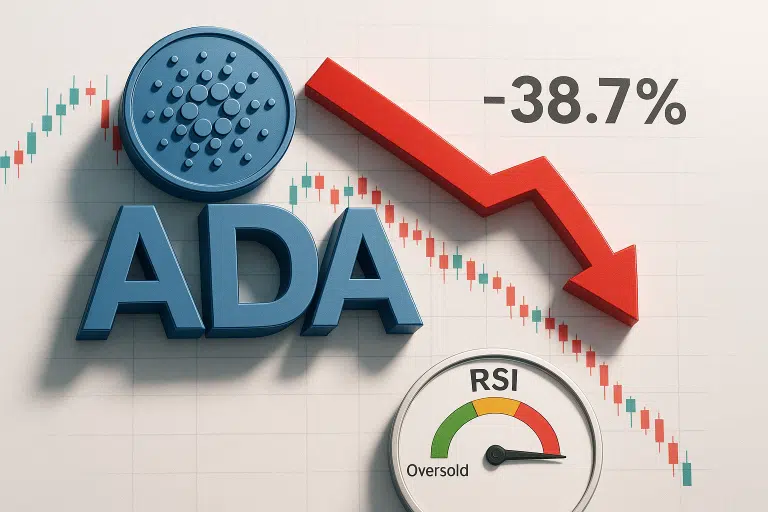
| RSI (Relative Strength Index) | 38.7 |
| ADX (Average Directional Index) | 18.3 |
| MACD (MACD Level) | -0.29 |
| CCI (Commodity Channel Index, 20-period) | -124.85 |
RSI Drops to 38.67 – First Oversold Reading Since August Washout
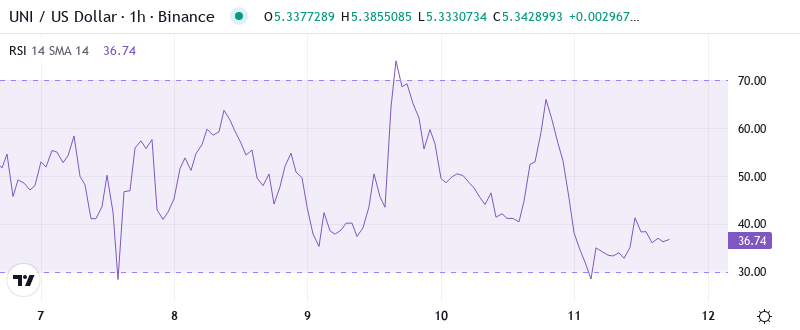
When the intra-market indicator hits a certain level, its corresponding asset is often considered overbought or oversold by traders. Given UNI recently tagged 28.23 on the daily Relative Strength Index (RSI), its most oversold reading since August 2021. The point is that UNI might soon be too hot to handle, temporarily losing steam before heading higher or slipping lower to attract more buyers. This sentiment is echoed when examining the monthly RSI configuration on 34.11.
Therefore, swing traders looking for a relief rally will find that the current RSI setup is the first genuinely mean-reversion trade since the Summer. Momentum obviously got nuked on the Blockchain Capital exit, but in general, those kinda venture moves tend to be more at the end of sentiment cycles than the beginning of them. It’s also worth noting that UNI has printed sub 40 RSI prints 3 times prior with the medium term low being the first reversion in all instances. UNI has reclaimed 25 and 35 RSI on the WT and the D1 in the past 24 hours, with the daily RSI of which needing to reclaim 25 for the WT RSI mean reversion to become tradable.
Weak ADX at 18.29 Signals Exhausted Sellers May Pause
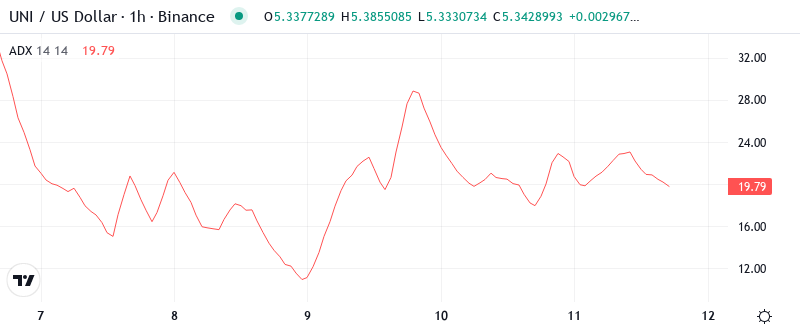
With an ADX of 18.29, what the heck does that mean? Well, despite the waterfall decline, the actual trending force behind this selloff is quite weak when we’re in this zone. The sellers have pretty much tired themselves out after dropping price by 42% over four weeks. There’s not enough “umph” in the market to create those big, continual moves in either direction.
In English, the ADX is telling us that the steady downtrend is giving way to possible sideways action. As a day trader, it’s time to adjust to that possibility and anticipate more range-bound, choppy action versus the easier-to-trade continuation patterns. The institutional selling that fueled the December slide has probably exhausted itself (suggested by the low ADX) and the panic selling probably ran its course.
Price Trapped Below Entire EMA Cloud Since December Breakdown
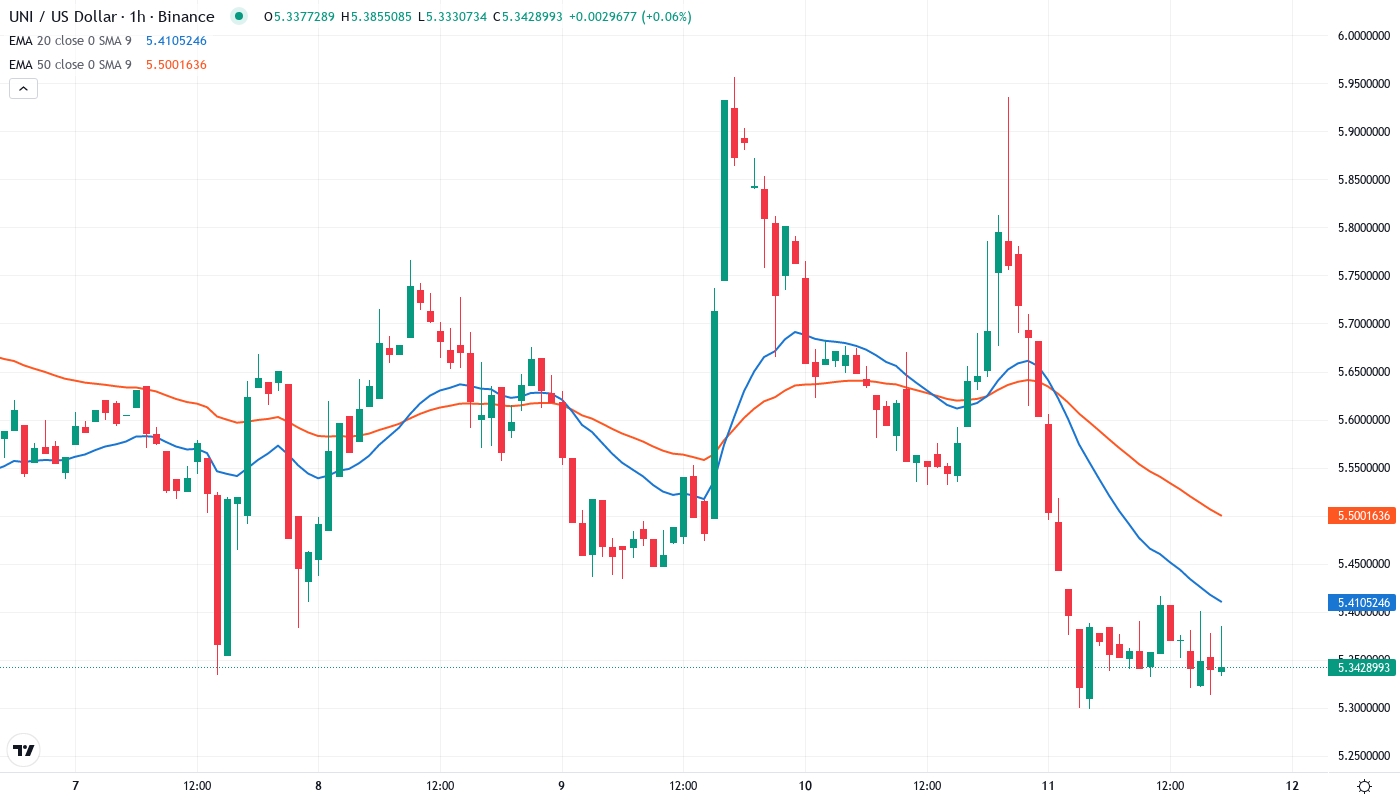
If you focus on the moving average structure, you can see that December did a lot of technical damage. UNI trades well below all the key EMAs – the 10-day ($6.08), the 20-day ($6.38), and most importantly, the 50-day EMA ($6.98). As a result, those support levels that turned into solid bounce zones this year turned into strong resistance barriers. The 20-day EMA in particular stands out as it has rejected sharp rebounds three times since the Blockchain Capital report.
The 50-day exponential moving average acts as resistance on a first backtest following a breakdown and is where the initial rebound attempt was rejected. The 20-day EMA is now drifting lower and will cross below the 50-day level at $5.91 soon. This active death cross will send the first EMA lowering the second EMA, alerting Technical traders to a worsening outlook – just as the 50-day will soon cross below the 200-day EMA which will confirm longer-term bearishness.
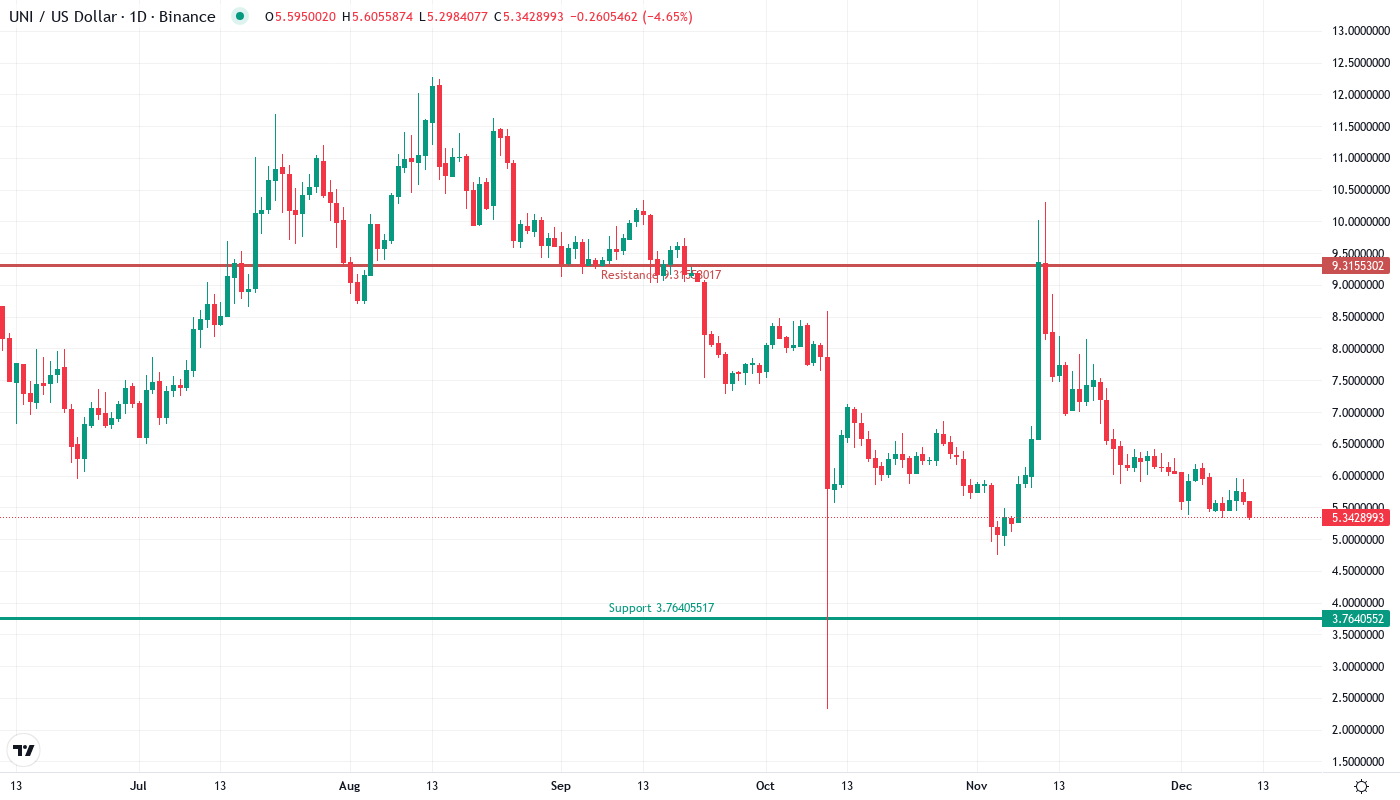
$5.30 Support Tested Six Times – Final Line Before Psychological $5
The $5.20-$5.36 cluster has managed to contain six distinct selling waves since the end of December, and seemingly, each time a sufficient amount of buyers entered the market to stop the bleeding. From a technical perspective, the monthly pivot point comes in at $5.47 and is likely to act as minor resistance on an intraday bounce. However, that was the level violated to the downside in December, warning of the collapse. Looking further down the chart, the $5.00 psychological mark is the next area of interest with no support identified until the June lows around $4.50.
There is strong resistance between $6.38 and $6.98, which is the confluence of the 20-day and 50-day EMAs and December’s break below support. Moreover, the monthly pivot must be taken out at $5.47 before any sustained attempt at a recovery can come into play. The 10-day EMA also awaits overhead at $6.08, with the primary resistance cluster still far above. The March 20th peak at $6.77 complements the aforementioned current gateway resistance. Additionally, the $6.48 millionBlockchain Capital profit-taking level near $6.50 constitutes another psychological top where bagholders could begin to sell for gains.
The price action is taking the shape of a downside reversal chart pattern. As the name suggests, the pattern is made up of two trendlines: support, which is horizontal and acts as a floor for the price action, and resistance, which slants up and acts as a ceiling. The support collects all the valleys and the resistance groups all the peaks to create a downtrending price action. 6 successful defenses of $5.30 make a good case for at least a temporary bottom. However, the complete absence of buying interest above $5.70 coupled with the overhead resistance suggests that any bounce will be sold into aggressively. The market structure indicates that sellers are in the driver’s seat until UNI can recapture and sustain above the 20-day EMA which is presently at $6.38.
Relief Bounce to $6.08 Most Probable Near-Term Path
Bulls need to push and close above $5.70 per day to show $5.30 holds and target the 10-day EMA of $6.08. If the fundamentals imply further upside, and the breakout of the 20-day EMA at $6.38 will likely draw in more buyers.
If the $5.30 support fails after having held on six tests, which has the potential to irrationally “trap” new investors who recently bought in hopes of a bottom, the last resort for bulls is the June 4 red candle low at $4.50. Replace trailing stops and wait-and-see breakout entries should be willing to endure a stop between $5.15 and $5.25 through September.
The Relative Strength Index (RSI) painted a severe oversold condition heading into the final days of December, and midweek ADX readings are at levels that have historically marked at least short-term exhaustion. In other words, while the longer term danger is apparent, the path of least resistance over the short term is sideways to higher. With late December’s ideal target off the institutional exit cited repeatedly in these reports for months getting very close, combined with a near guaranteed loss of RSI and double or triple daily standard deviation losses, it would appear a bounce is imminent. If, however, we see any dailies close between $5.20 and $5.70, assuming we haven’t already closed below the 360 two-week moving average at $5.04 either today or the next few, very likely indications will be continued basing throughout the week around the 360 DMA at approximately $5.05.