Uniswap Tests Critical $5.40 Support as Regulatory Headwinds Mount
Market Structure Shifts Lower
- UNI has dropped 30.3% this month, in line with weakness in the wider DeFi space
- Institutions withdraw $6.48M, signaling hesitation at the higher levels
- Price is holding multi-month support at $5.40 after a six-month long slide
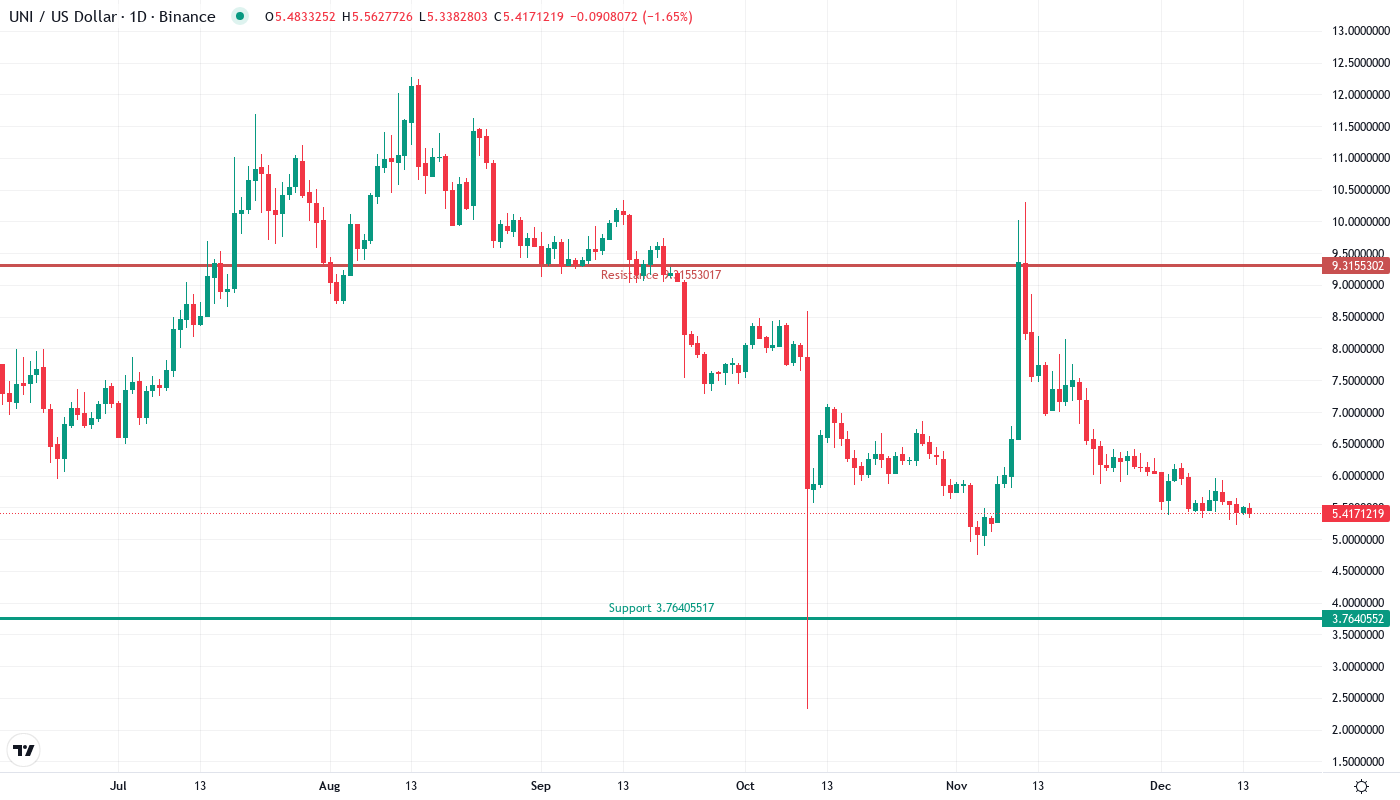
UNI token is currently trading at $5.40, losing 30.3% over the past 30 days as institutional outflows and regulatory concerns weigh heavily on the largest DeFi DEX. The largest DEX by trading volume has lost 69.1% from highs reached earlier in the year, with Blockchain Capital’s recent $6.48 million outflow encouraging additional liquidation in a market that is already in free fall. The burning question for traders is whether the multi-tested $5.40 region can continue to support price, or if mounting concerns fling it lower yet again.
| Metric | Value |
|---|---|
| Asset | UNISWAP (UNI) |
| Current Price | $5.40 |
| Weekly Performance | -3.15% |
| Monthly Performance | -30.28% |
| RSI (Relative Strength Index) | 39.5 |
| ADX (Average Directional Index) | 19.7 |
| MACD (MACD Level) | -0.28 |
| CCI (Commodity Channel Index, 20-period) | -93.07 |
RSI at 39.5 Signals Oversold Territory Without Capitulation
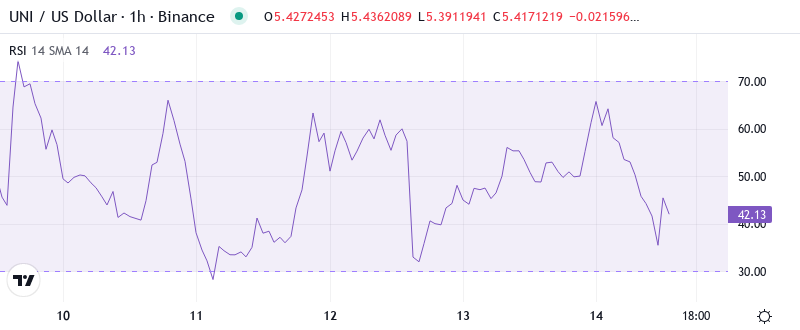
The oscillator is at 39.5 on the daily timeframe, indicating oversold conditions for the first time since the August washout – but without the extreme capitulation readings below 30 that typify major lows. This implies that we are somewhat in ‘no man’s land’ in terms of positioning, whereby sellers are still firmly in the driving seat despite stretched momentum indicators, implying scope for further deterioration should nearby support levels give way.
Previous RSI set-ups of a similar nature during the Summer ended in sharp relief rallies once the indicator breached the 35 level, which is at least some cause for optimism for the patient bulls out there. For swing traders, this particular oversold-but-not-extreme set-up means waiting for either a momentum divergence, or a solid breach of the 35 level to take your position – the current cap on any bounce being the overhang of regulation from Citadel’s DeFi push of course.
ADX Drops to 19.7 – Range Traders Rule as Trend Evaporates
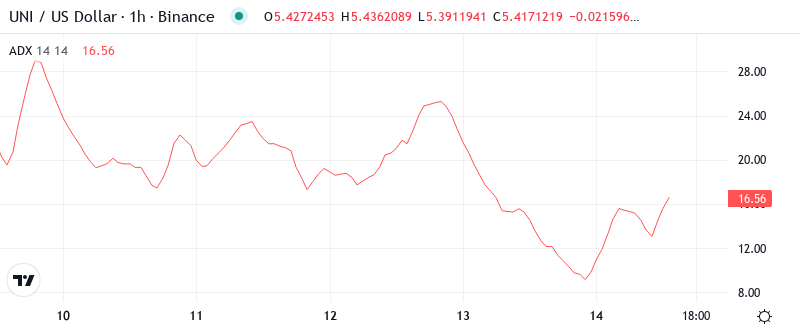
The strength of the trend has now completely disappeared, with the ADX falling to 19.7. This indicator shows that the directional momentum has been replaced by unstable and sideways movement. This means that the bulls and the bears are unable to control the market for more than a few sessions.
To put it simply, this weak ADX reading shows that we are in steady accumulation or distribution mode. This is great for range traders but dangerous for trend followers. So day traders will just have to make do, concentrating on support and resistance ping-pongs for now, and putting breakout trades on hold until ADX rises above 25 and establishes a trend.
50-Day EMA at $6.28 Becomes Distant Resistance After Support Failure
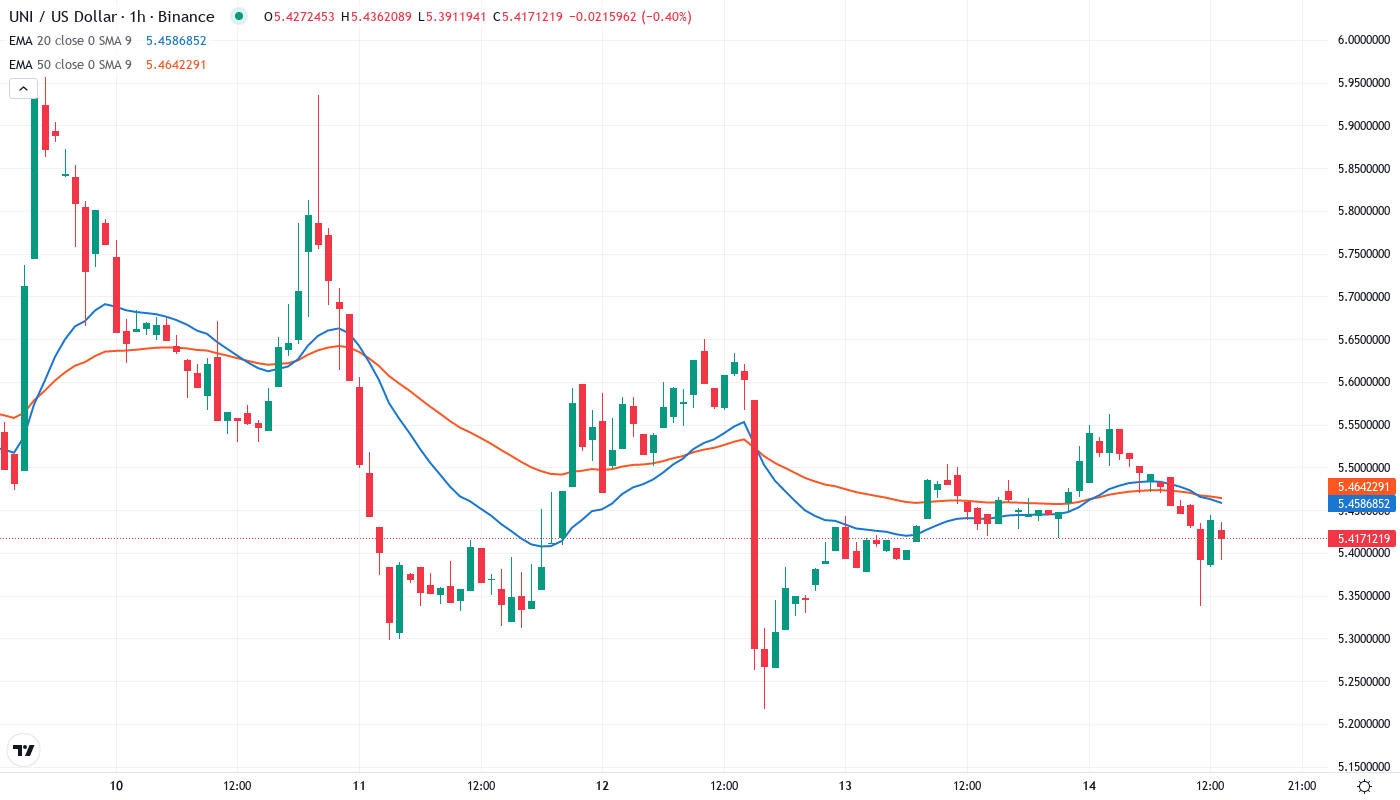
The 10-day moving average will hopefully decrease the stress on the 20 and 50-day EMAs. If UNI can recover these levels, then the token can launch a considerable upswing. Buyers would first face a minor resistance at the $6 round number before aiming higher at the 100-day EMA at $6.88. Should the buyers continue to climb, UNI could also target the $7.23 level, marking the 50-day EMA.
What is especially interesting is that in December the advances were rejected three times, before the price collapsed further, turning the previous support into strong resistance. Now, bulls have to try to recover the entire EMA ribbon, not just one moving average, and the 50-day at $6.28 is the first important obstacle for any recovery.
$5.40 Support Tested Six Times – Bulls Make Their Stand
Bulls are trying to prevent a strong bearish breakout that could potentially trigger panic selling. The pivotal level to the downside is $5.40, which if broken can lead to a selloff. On the upside, resistance levels are significant with the December breakdown point of $7.10, which is near the 100-day EMA trendline.
The support structure below appears quite precarious following the 30% monthly drop, with only slight props at $5.22 (monthly low) and $4.36 (June low) blocking a test down to $4.00. The weekly pivot points present an even graver image, with S1 running all the way down at $3.76 – 30% below current levels.
The market structure suggests a double bottom if the 6-hour candle closes above $5.40, but a likely stop-loss cascade if UNI closes below this level.
Bulls Need Momentum Shift Above $6.28 to Reverse Bearish Structure
Buyers need to push the price beyond the 50-day EMA at $6.28 just to start altering this bearish framework, and then cross over the resistance region of $7.00-7.10, where trading broke down in December. After that, the token could aim for the 100-day EMA close to $7.50, with hopes of new legal regulations or a fresh attention from institutions pushing its value higher.
If the support at $5.40 is broken, particularly on significant volume, the resulting cascade of stop-loss orders from new long positions is likely to breach the June low of $4.36. The recent news on the regulatory front spells trouble, combined with the added pressure from Blockchain Capital.
With the RSI in oversold territory, the ADX indicating a non-trending environment, and UNI sitting on major support, a continued chop seems most likely as the market continues to digest regulatory news. For now, any further downside of significance will likely be a result of the bigger picture dragging UNI beneath $5 into the strong support in the low $4s. Conversely, a sharp bounce could theoretically find resistance around $6 before taking another major level at $7 into account. Any resulting recovery from this level likely finds resistance around $6.40 and previous support at the low $7s. Should UNI managed to finally lose $5 support, the resistance at the $5.80 Chop Zone will likely turn into support and create a stronger level above the round number.