Uniswap Surges 31% as CCA Protocol Launch Transforms DEX Landscape

Market Structure Shifts Higher
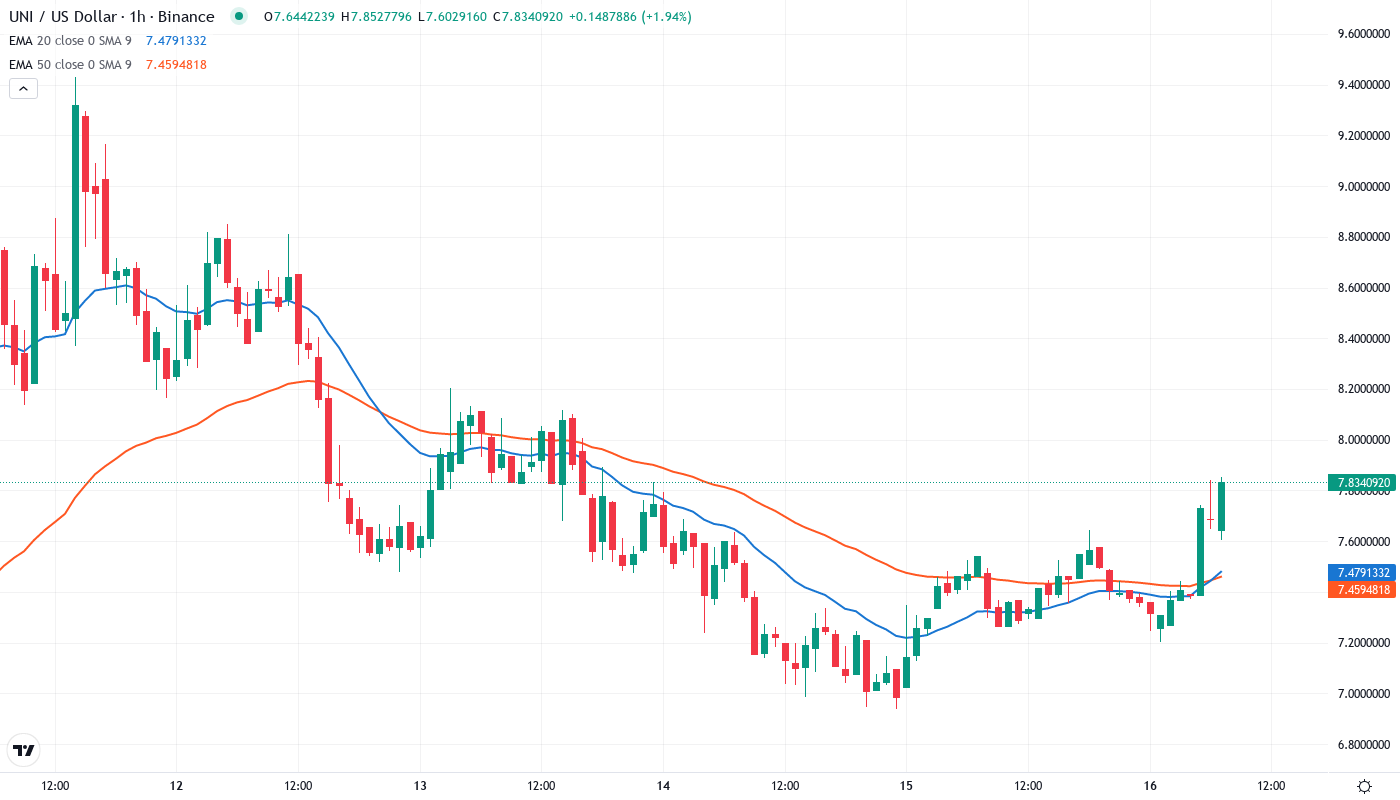
- UNI climbs 31.4% this month, erasing prior weakness with conviction
- Revolutionary CCA protocol targets manipulation, enhancing platform fairness
- Price reclaims critical EMAs as momentum builds from oversold bounce
Uniswap darted through multiple resistance levels this month, posting a convincing 31.4% surge that transformed the technical picture from bearish to constructive. The decentralized exchange token shed its November weakness after introducing Continuous Clearing Auctions (CCA) – a protocol upgrade designed to eliminate front-running and manipulation that has plagued token launches. The main question for traders is: can this fundamental catalyst sustain the technical breakout above key moving averages, or will sellers emerge at familiar resistance zones?
| Metric | Value |
|---|---|
| Asset | UNISWAP (UNI) |
| Current Price | $7.80 |
| Weekly Performance | 30.06% |
| Monthly Performance | 24.14% |
| RSI (Relative Strength Index) | 57.4 |
| ADX (Average Directional Index) | 35.1 |
| MACD (MACD Level) | 0.30 |
| CCI (Commodity Channel Index, 20-period) | 73.80 |
RSI Climbs From Oversold Territory – First Recovery Signal Since October
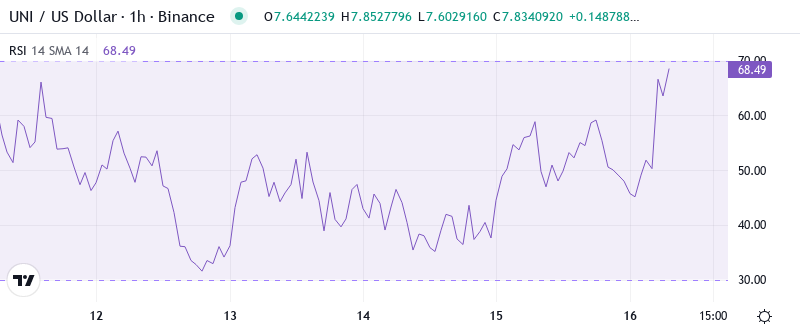
Reading the oscillator at 57.39 on the daily timeframe reveals momentum has normalized after touching deeply oversold levels below 30 just weeks ago. The recovery mirrors September’s bounce pattern, when RSI crossed above 50 and sustained that level for three weeks before the next leg higher materialized. What’s particularly telling is how quickly sentiment shifted once the CCA announcement hit – RSI jumped 15 points in 48 hours, confirming genuine buying interest rather than a dead cat bounce.
So for swing traders, this balanced RSI configuration suggests room for continuation without immediate overbought concerns. Similar setups in Q2 2024 preceded 40-50% extensions once RSI consolidated between 55-65 for a week. The CCA launch provides the fundamental backdrop that was missing in previous failed rallies, giving this momentum shift more credibility than typical oversold bounces.
ADX at 35.1 Confirms Trend Emergence After Months of Chop
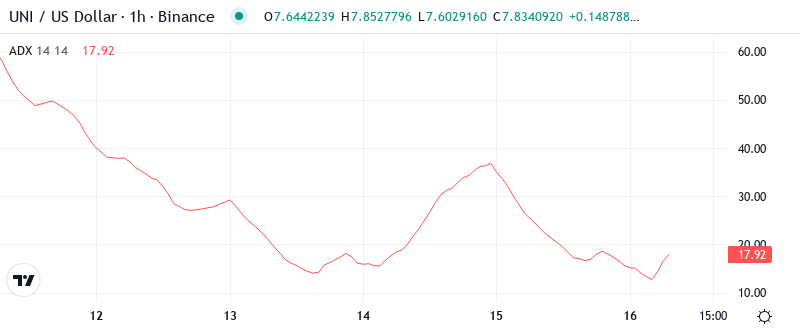
At the level of 35.1, the ADX entry indicates robust directional movement has replaced the sideways grind that dominated Q4. Basically, when ADX pushes above 30 with this velocity, it signals institutional players have picked a side – and they’re currently backing the upside. The indicator spent most of autumn below 20, keeping UNI trapped in a $4.75-$6.50 range that frustrated both bulls and bears.
This trending environment favors momentum strategies over mean reversion plays. To clarify, the ADX is indicating that fade attempts against this move carry higher risk than usual, especially with the CCA rollout providing ongoing positive catalysts. Day traders should adapt their approach accordingly – riding momentum rather than fighting it until ADX shows exhaustion above 40 or starts curling lower.
20-Day EMA at $6.85 Flips From Resistance to Critical Support
Price action through the EMA ribbons tells a compelling reversal story. UNI now trades above both the 20-day ($6.85) and 50-day ($7.07) EMAs after spending two months trapped beneath this dynamic resistance cluster. The 20-day EMA rejected advances four times between October and December before finally breaking on volume alongside the CCA announcement – classic resistance-to-support flip behavior.
Most significant is how price respected the 20-day on yesterday’s pullback, bouncing precisely at $6.84 before resuming higher. This former resistance area transforms into the red line for bulls to defend on any further retracements. The 100-day EMA waits at $7.60 as the next major test, while the 200-day at $7.76 represents the final boss level for this recovery attempt. Given the fundamental shift with CCA deployment reducing manipulation risks, these longer-term averages could flip bullish for the first time since August.
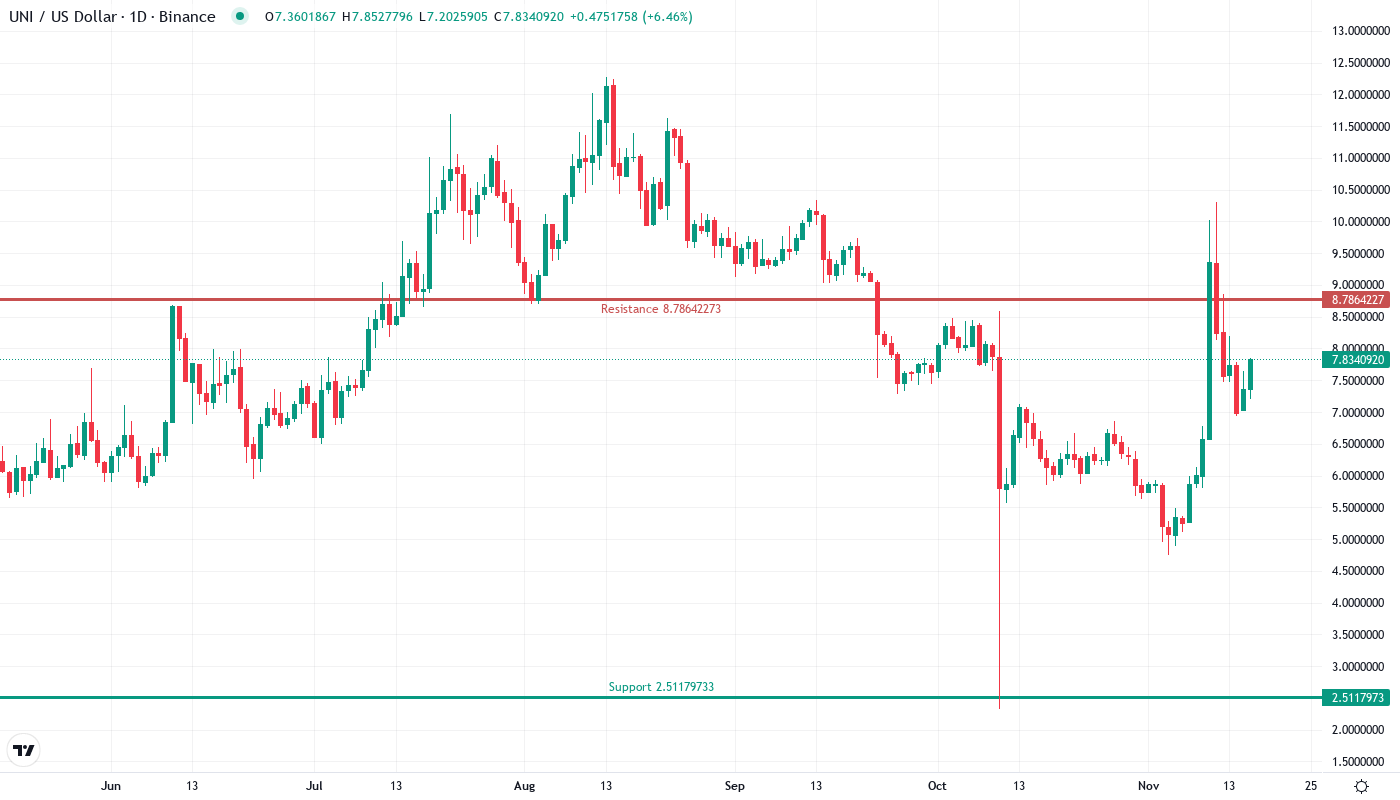
Resistance Clusters Between $8.50 and $10.30 as Bulls Eye Monthly High
Above current levels, sellers have fortified multiple resistance zones that coincide with psychological round numbers and pivot points. The immediate hurdle sits at $8.16 where the 100-week EMA converges with December’s failed breakout high. More substantial resistance stacks between $8.50-$8.78, marking the monthly R1 pivot and the 200-day MA confluence – a zone that’s capped rallies three times this year.
Bulls defend a robust support architecture thanks to this month’s technical repair work. The $6.85-$6.91 zone now offers first support where the 20-day EMA meets the weekly pivot. Deeper support emerges at $5.55, aligning with the monthly pivot and January’s breakout point. This level has transformed from resistance to support following the CCA-driven surge, creating a higher low structure absent since Q3.
The market structure signals renewed buyer control as long as UNI holds above $6.85 on any profit-taking. Weekly timeframe analysis shows price attempting to break a six-month downtrend line at $7.80, with a confirmed break targeting the $10.30 monthly high. The CCA protocol launch fundamentally alters Uniswap’s competitive position, potentially justifying a retest of 2024 highs if adoption metrics confirm the upgrade’s impact.
Bulls Require Weekly Close Above $7.80 to Confirm Trend Change
Should price secure a convincing weekly close above the $7.80 downtrend line, bulls would target $8.50 initially, then $10.30 as the CCA ecosystem development provides ongoing catalysts. The protocol’s promise to eliminate front-running could attract institutional liquidity providers previously deterred by manipulation concerns.
The bearish scenario triggers if UNI fails at $8.16 and drops below $6.85 on volume – trapping recent CCA buyers and likely flushing positions toward $5.55. Loss of the 20-day EMA would signal the rally exhausted despite fundamental improvements, confirming resistance remains too heavy.
Given current momentum and the CCA deployment’s market impact, the most probable near-term path sees UNI consolidating between $7.20-$8.20 while digesting this month’s 31% surge, before attempting the next leg higher toward $10 resistance.