Uniswap Governance Shakeup Ignites 30% Monthly Surge as UNI Tests Critical Resistance
Market Structure Shifts Higher
- UNI experienced a remarkable 30% surge this month, following the acceptance of the proposal to implement protocol fees, thus, it has recorded the best monthly performance since March.
- The breakout from a multi-month downtrend is the co-occurring event of a landmark governance vote to burn 100 million tokens.
- Although the price is approaching major resistance at $10.29, the technical indicators appear to send mixed signals while the momentum decreases.

Uniswap’s native token has jumped by 30% in the last month, starting at $6.60 and currently trading at around $8.59 as the community endorsed a radical governance proposal. This movement wiped out three months of stagnation and brought UNI back to almost double digits for the first time since August. The main dilemma for traders is this: whether the bulls can hold the momentum and push through the psychological $10 level, or will the income from selling provoke another downturn after the governance-led surge?
| Metric | Value |
|---|---|
| Asset | UNISWAP (UNI) |
| Current Price | $8.59 |
| Weekly Performance | 65.24% |
| Monthly Performance | 46.50% |
| RSI (Relative Strength Index) | 66.6 |
| ADX (Average Directional Index) | 37.8 |
| MACD (MACD Level) | 0.17 |
| CCI (Commodity Channel Index, 20-period) | 292.40 |
Momentum Metrics Flash Warning Signs
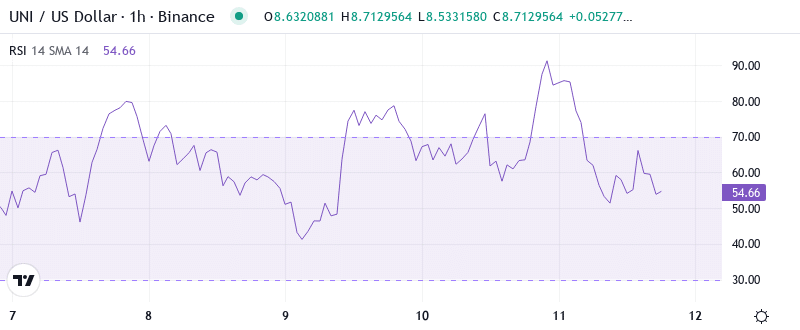
The current RSI index is 59.77, which places it in the neutral zone on the daily timeframe chart after it has cooled from the previous overbought level above 70 last week. The fact that it has been pulled back from extreme levels shows that the previous excitement over the proposed activation fee has declined, thus giving space to move in both ways. Similar RSI configurations in September were observed before a 15% correction and then the next upward movement happened.
In the case of swing traders, this balanced RSI suggests that the current level is good for entries with the slight risk being manageable, if the stops are placed below the $7.90 support level that was maintained during yesterday’s shakeout. The weekly RSI at 57.44 reassures that the general bias is still positive even with a temporary uncertainty. Amid the findings, the monthly RSI measure of 45.52 signals that the instrument can still make significant gains before it approaches the historical resistance levels.
Trend Strength Building Gradually
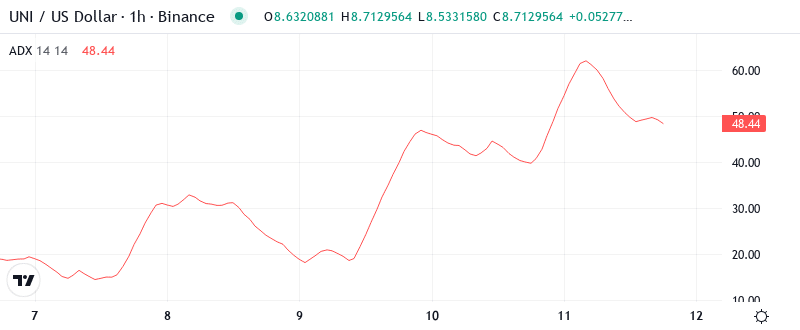
The ADX reading at 14.26 is still in the state of trend strength developing but it doesn’t show much certainty yet. To be more precise, staying in the range means that UNI has entered the directional phase after previously being in the mixed $6-7 area, but sellers are still holding on to their positions. The obvious change in the market structure from consolidation to trending conditions was the governance proposal unveiled to the public that the supply would be cut by 16% through burns.
In fact, the ADX indicates that we’re in a period of beginnings of a shift of the situation rather than the peak. Accordingly, day traders should emphasize the trending market strategies over the range-bound setups and deal with the pullbacks to the rising supports even not with the fading rallies. The conjunction of fundamental catalysts and strengthening technicals makes it a terrain for dips to pull buyers in, instead of starting it off with further downside triggers.
Price Reclaims Critical Moving Averages
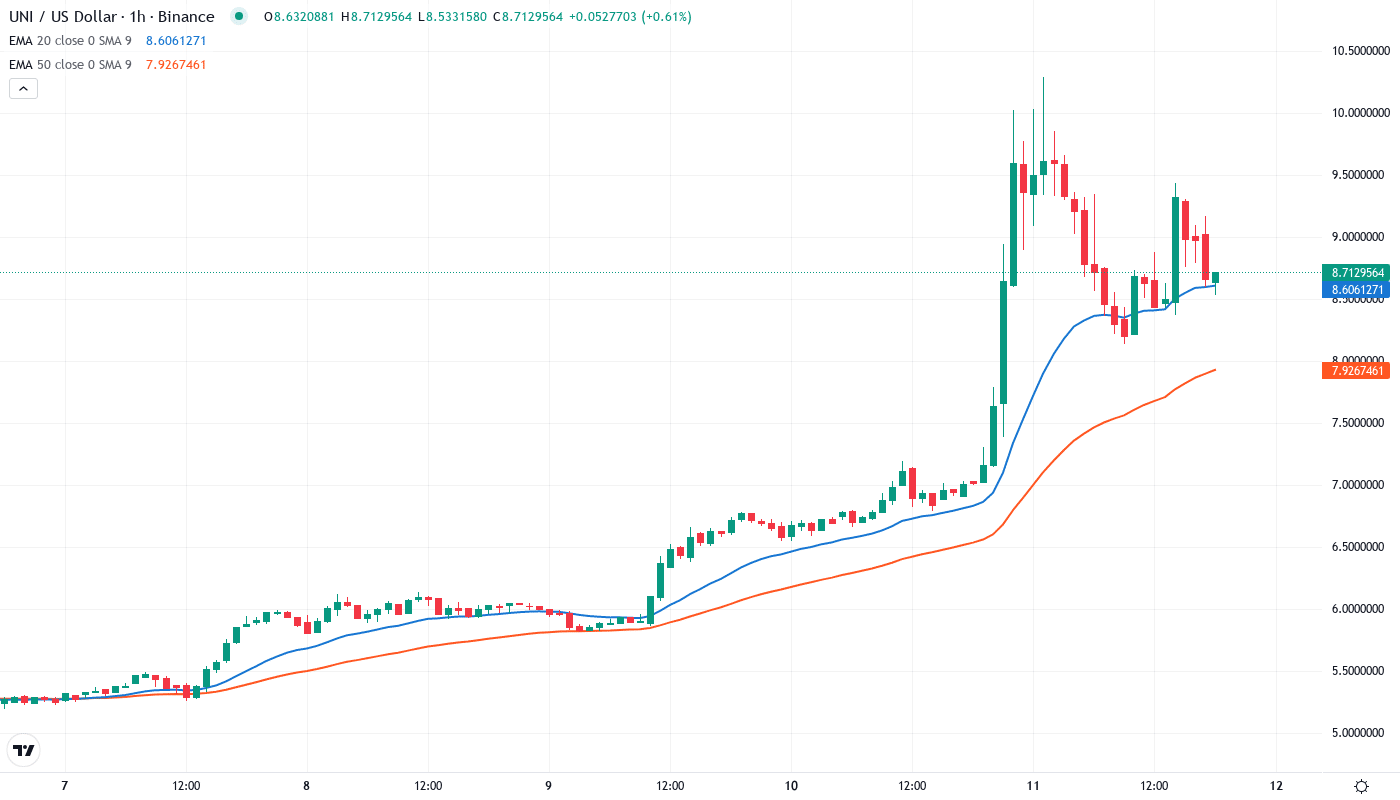
The price movement demonstrates vivid upward movement via the EMA ribbons. UNI has been performing above the 10-day ($6.88), 20-day ($6.55), and, most importantly, the 50-day EMA at $6.98, which has been the support of UNI after it has been resistance for a week. This price area resisted progresses on three occasions in November before SHE has been the one to breach it finally on volume as news of governance was published.
The 100-day EMA which is currently situated at $7.61 acts as the primary support during the retracement while $7.99 the 200-day EMA is the next considerable barrier boistered by the test above. The area around $8 which used to be a resistance shift into a significant line for bulls to safeguard at the time of the pullback. Weekly EMAs create an even more positive outlook, showcasing the price surpassing the 10-week EMA at $7.55 and getting closer to the 20-week EMA at around $8.05 – the levels that stuck rallies over the summer consolidation.
Technical Levels Define the Battlefield
The intermediate resistance networks occur owing to the combination of December peaks with psychological whole numbers, between $10.29 and the weekly high at $10.89 where they converge. This area has negated the entry of most attempts in 2024 and still is the last hurdle before UNI can seek the yearly pivot at $11.83. The bulls need stable trading volumes and most probably a different economic factor to overpower this hard block.
Support structure is looking more and more sustainable after the surge this week. The $7.90-8.00 range is now the initial zone for defense, backed by the 200-day EMA and the prior resistance from October. Underneath that, $7.29 is the weekly low and the rising 50-day EMA that coincides with it, which adds to the confluence that dip buyers should be interested in.
As far as buying is concerned, it is message by the market structure that indeed, the exclusive token of Uniswap, UNI, should stay above the psychological point of $7.50, even during a retracement. The ongoing higher lows since the bottom of November at $6.98 are still intact, which means that accumulation is still ongoing, in spite of the fact that there are some short-term profit-takers selling at resistance.
Path Forward Hinges on Governance Execution
To confirm the bullish breakout and aim for $11.83, the bulls must register a daily close above the$10.29 threshold while the launch of the activation fee is backing up the fundamental aspect. On the other hand, any push through the resistance levels would require adequate volume – long holidays with less liquidity can spur false breakouts that ultimately leave the late buyers in a trap.
Should the price be strongly rejected at $10.29 and go down below $7.90 on volume break thus, the bearish scenario will be triggered. This would be the sign for the governance rally to come to an end and a retest of the $6.98 support would probably happen. Look out for divergences between the price and the momentum indicators to be the first signals of the market heading in the opposite direction.
Considering the present trends and the revolutionary form of the governance amendments, the most fitting immediate speculation appears to be the distribution of UNI in a $8.50-10.00 range while acquiring the excess of its recent gains and then trying to elevate it for the last time of the year.