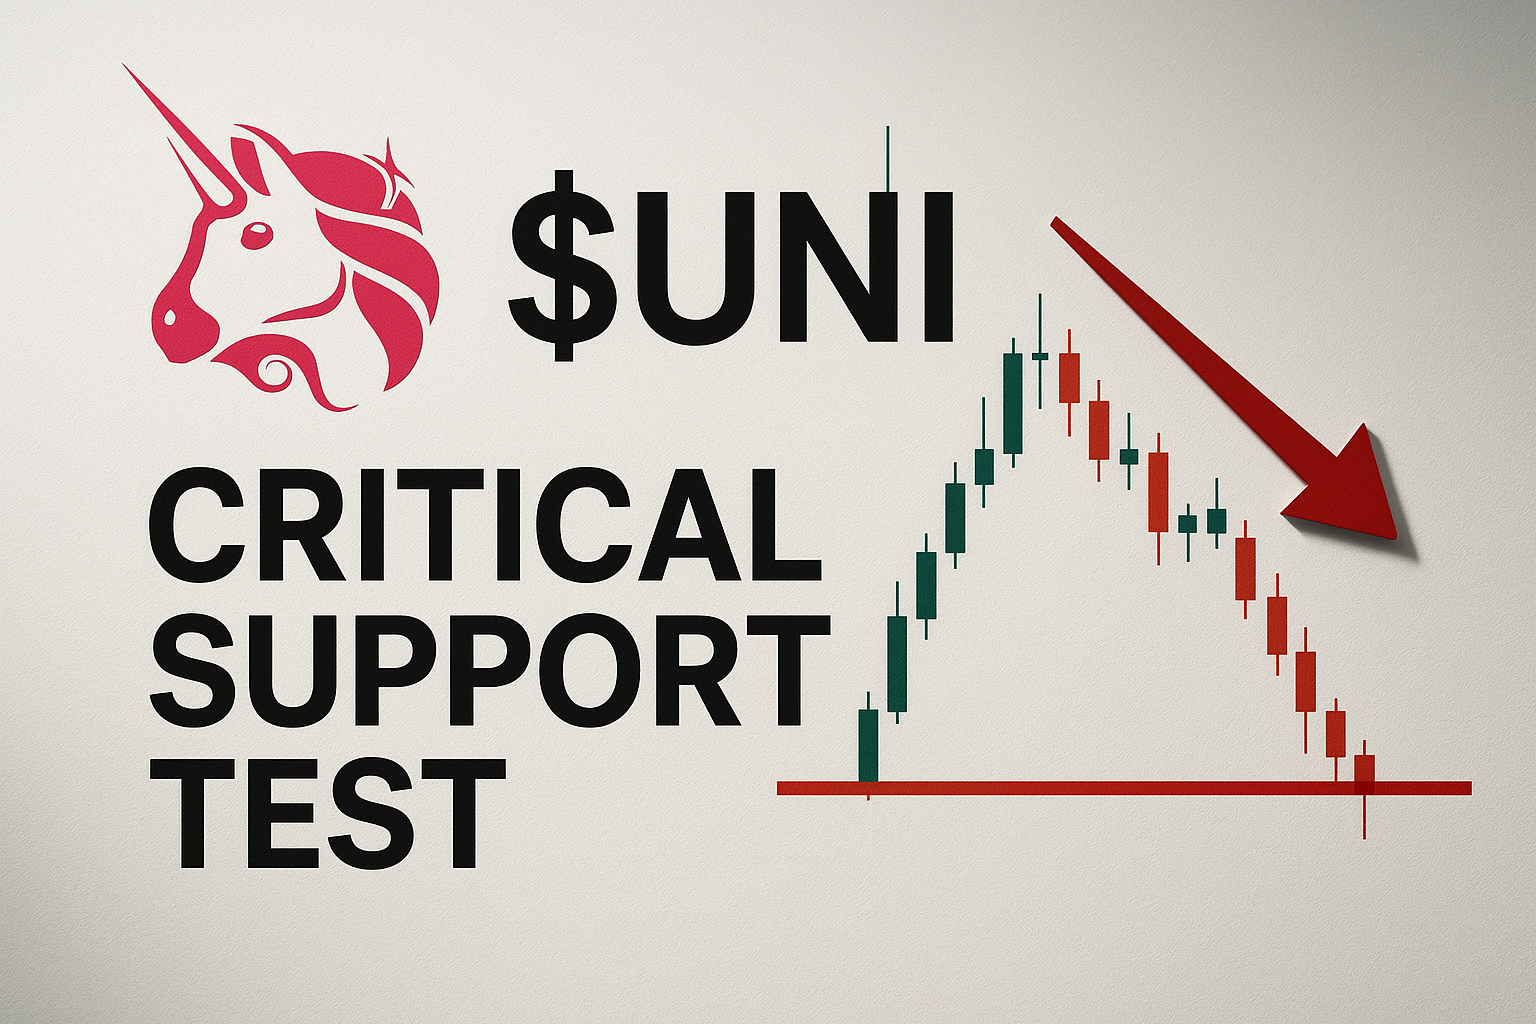
UNI Tests Critical Support as Token Burn Approval Meets Technical Weakness
Market Structure Shifts Higher
- The Governance approved a milestone of 100M UNI token destruction, fueling deflation.
- Despite this fundamental catalyst, the price dropped 22% in a month.
- Indicators are showing potential for a bounce as it is oversold at $5.94.
The Uniswap community’s approval of two governance proposals could be a strong fundamental argument in favor of such a relief rally. First, the historic burn of 100 million UNI represents nearly 15% of all tokens that will ever exist. In the short term, the burn removed $50M worth of tokens from circulation, which might not seem like much, but it represents nearly half of Uniswap’s $109M market cap. Those 100 million relinquished tokens had been set aside in the protocol’s treasury since day one to be deployed in the future as a buffer against emergencies. The team decided they had enough to operate and oversee the project without a need for the additional tokens.
| Metric | Value |
|---|---|
| Asset | UNISWAP (UNI) |
| Current Price | $5.94 |
| Weekly Performance | 11.78% |
| Monthly Performance | -5.80% |
| RSI (Relative Strength Index) | 53.2 |
| ADX (Average Directional Index) | 17.4 |
| MACD (MACD Level) | -0.02 |
| CCI (Commodity Channel Index, 20-period) | 74.12 |
Oversold RSI at 53.24 Signals Potential Reversal Zone
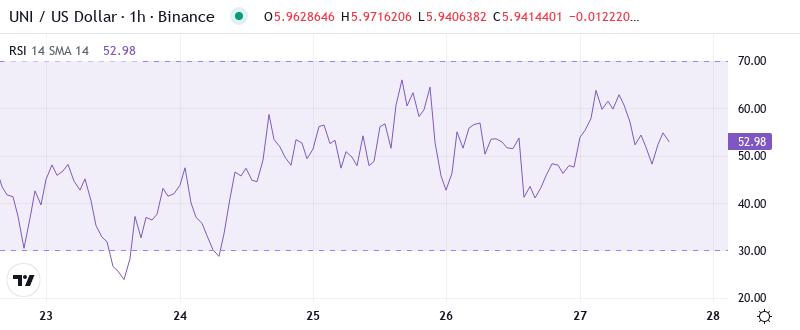
The Relative Strength Index (RSI) is at 53.24 daily time frame, it is slightly above the neutral 50 threshold as it has rebounded from more oversold levels earlier this week. This indicates that the panic selling has likely worn off, and the indicator is consolidating in an area that had usually sparked relief rallies in UNI’s recent downtrends.
What is interesting to note is that how RSI reacted after the governance announcement, it hardly moved showing that news or no news, sellers were going to be in charge of the price action. Both the earlier RSI setup were witnessed in September and November also saw local bottoms being hit before throwing a relief rally of 15-20%. Hence for swing players, this kind of an even RSI and the token burn news could indicate the zones where accumulation could be going on, but to confirm the same a break above 60 should give you the entry signal.
ADX at 17.41 Confirms Range-Bound Conditions Persist
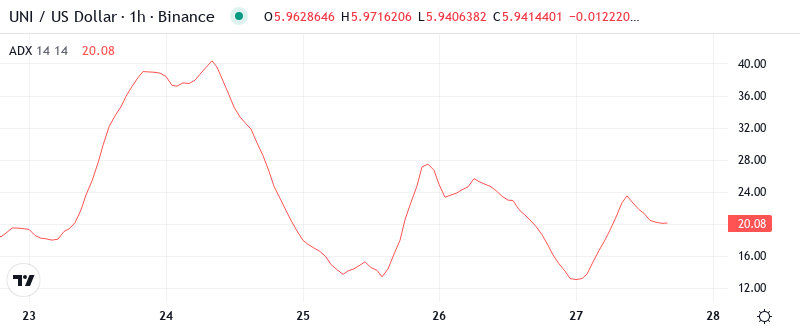
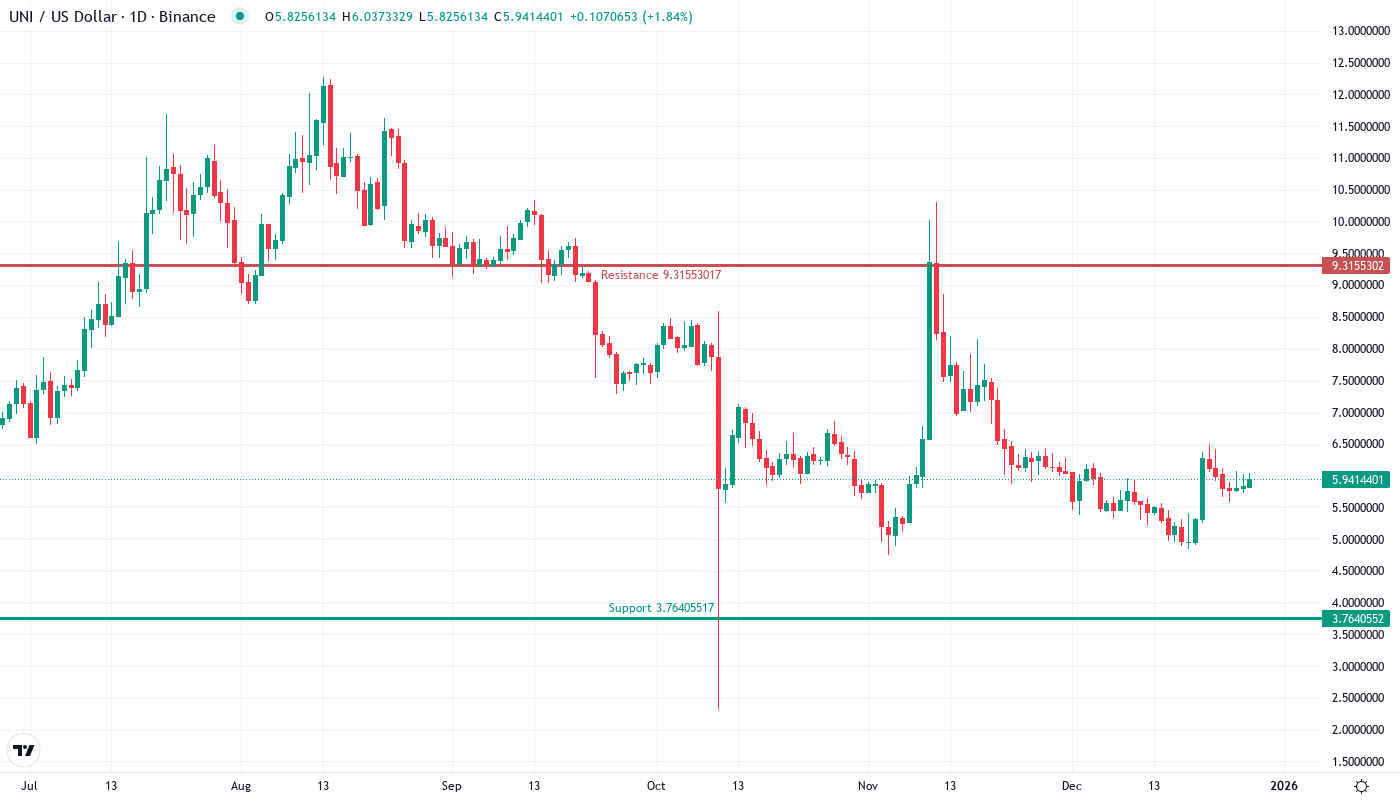
When it comes to trend strength, the ADX reads 17.41, which is well below the 25 threshold differentiating between trending and choppy markets. A low reading like this backs up what the price action is already detailing – UNI is stuck within a consolidation phase ranging between $5.74 support and $6.50 resistance and there’s no clear bias from the bulls or the bears.
So, ADX is telling us that while we suffered a hefty monthly loss, we’re moving from a trending environment to a trading environment. The governance news came during this consolidation and that’s why the initial response was fairly muted. As a day trader, you want to stay with the long side or shorts of the range until the ADX surpasses 25 and the new trending cycle gets underway.
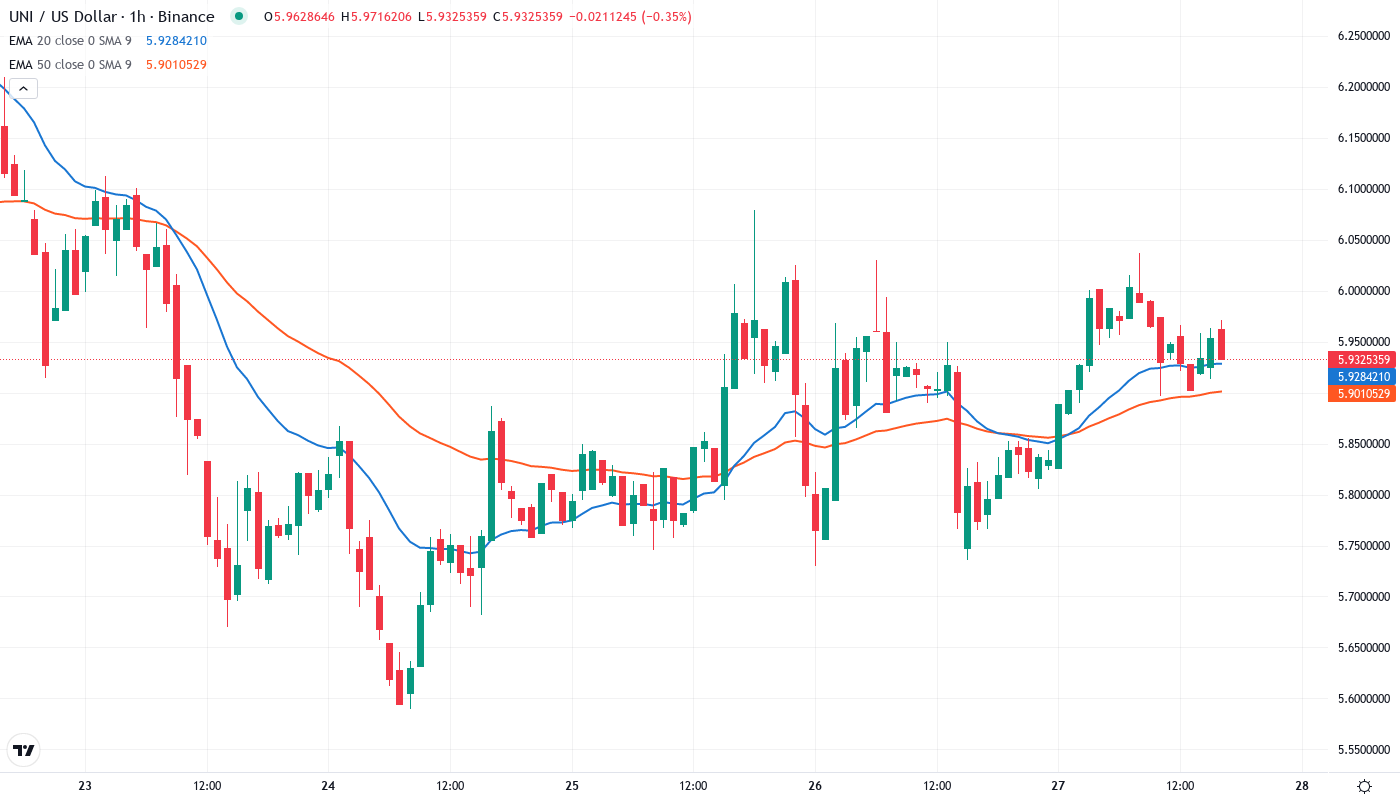
20-Day EMA at $5.74 Emerges as Make-or-Break Level
The ribbon spans back to late October when the token rallied to the $3.20 region, then saw numerous touches as support during consolidation, and was eventually breached to the upside ($3.40) on the news of Uniswap governance. This turned the ribbon from resistance to potential support.
The 20-day EMA at $5.74 becomes a crucial inflection point – it capped upside in late November’s kneejerk lows that resulted from the Black Friday dump but is the last barrier before broader 100-day EMA support at $5.53 comes into play. It’s a scenario that’s often described as a compressed spring, with token burn news potentially providing fundamental impetus needed to retake the 50-day EMA and flip market structure back bullish. Bears will want to see this $5.74 level immediately taken back on any retest.
Support at $5.74 Holds While Resistance Stacks at $6.50
There are some price levels where it is harder for the price to break through and go higher. These are called resistance levels. The price resistance in this case is between $6.27 and $6.50.
Bulls are likely to be overwhelmed if price manages to break below all 3 support levels, paving the way for a retest of uncharted and very sparse liquidity between $5.20–$5.00.
As long as the token doesn’t go below $5.74, it is advantageously positioned for buyers. Conversely, any daily closure that is less than the support could trigger additional sell stops, opening the door for additional downside with the possibility of hitting the $5.53 level or even the yearly lowest point of $5.47.
Token Burn Catalyst Could Spark Breakout Above $6.50
Buyers stepping in at the 20-day exponential moving average (EMA) is an encouraging sign, but they are far from out of the woods since price is still contained within the channel and the lower highs continue to put developing bullish momentum in limbo. Be mindful of the converging 20 and 50-day EMAs as potential sources of dynamic resistance as price attempts to rise back through last week’s local top.
We will see further upside if the bulls can hold above $5.74 by the close today. The VPVR shows minimal resistance above this level, which means it should be a quick shot to $6.03, the 50-day EMA. Closing the week above this level would position for a move back to the weekly level at $7.00.
UNI is likely to bottom between $5.74-$6.50. This projection is validated by the TD Sequential Indicator, which presented a green ‘8’ buy setup on UNI’s 4-hour chart indicating that the low is near. The subsequent price action will likely range trade between the setup trend and the setup support level at $5.74.