Toncoin Tests Critical Support at $1.51 as RSI Signals Extreme Oversold Territory

Market Structure Shifts Lower
- TON lost an additional 18.5%, trading at $1.51.
- Yearly peak of $5.46 has tumbled 72%.
- Uncertainty whether the overbought rally has begun or token unlock will cause further declines.
TON has suffered one of the steepest declines of a leading cryptocurrency this year.
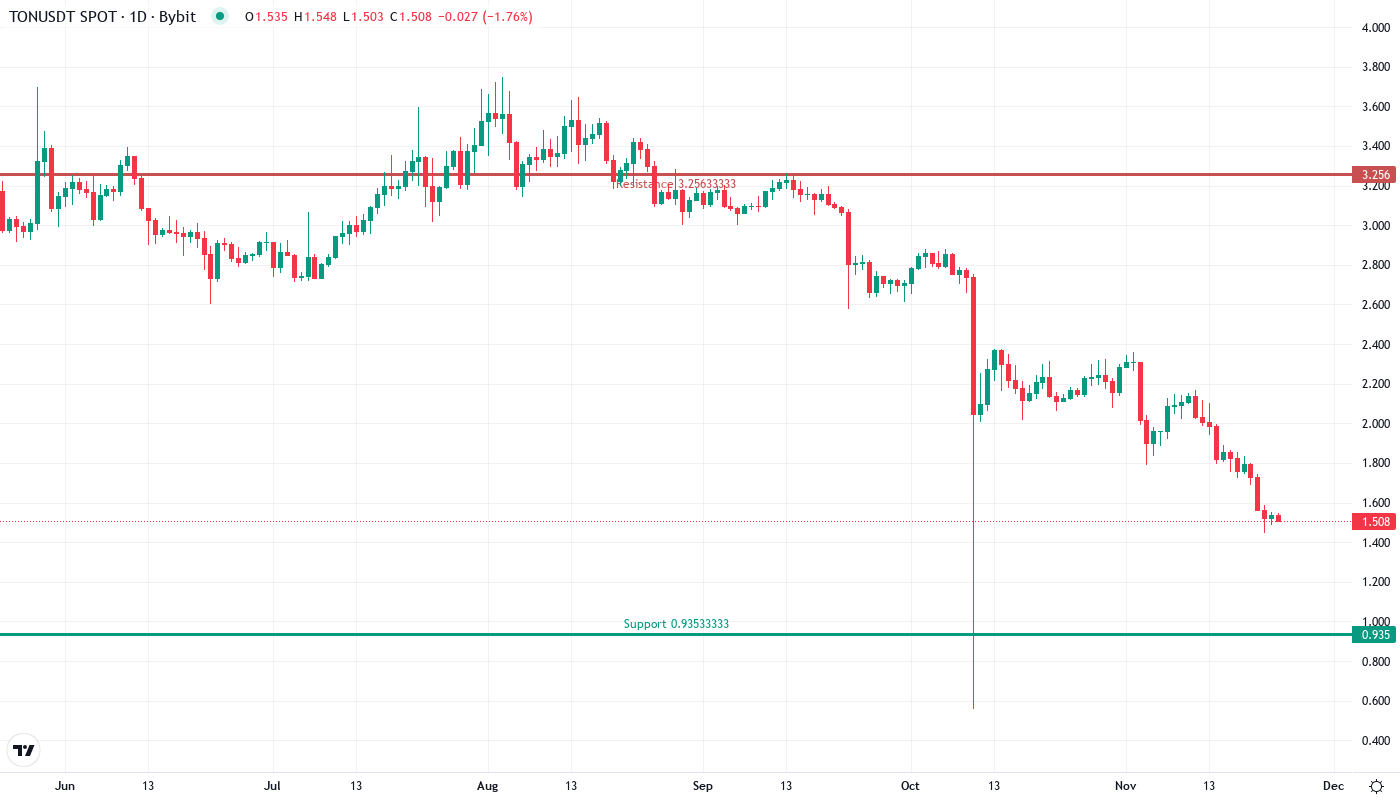
The recent drastic fall of Toncoin continued this week as the token lost an additional 18.5%, trading at $1.51 – a price that hasn’t been observed since 2023. The yearly peak of $5.46 has tumbled 72%, making it one of the most extensive pullbacks of the entire crypto boom, despite the fact that CoinShares initiated an ETP for Toncoin in Europe and TON was added to the Coinbase roadmap. The primary question on most traders’ minds will be whether the overbought rally has started or if this week’s $161 million token unlock will lead to further declines.
| Metric | Value |
|---|---|
| Asset | TONCOIN (TON) |
| Current Price | $1.51 |
| Weekly Performance | -18.49% |
| Monthly Performance | -28.91% |
| RSI (Relative Strength Index) | 24.8 |
| ADX (Average Directional Index) | 55.3 |
| MACD (MACD Level) | -0.18 |
| CCI (Commodity Channel Index, 20-period) | -141.36 |
RSI at 24.8 Matches Historic Capitulation Zones
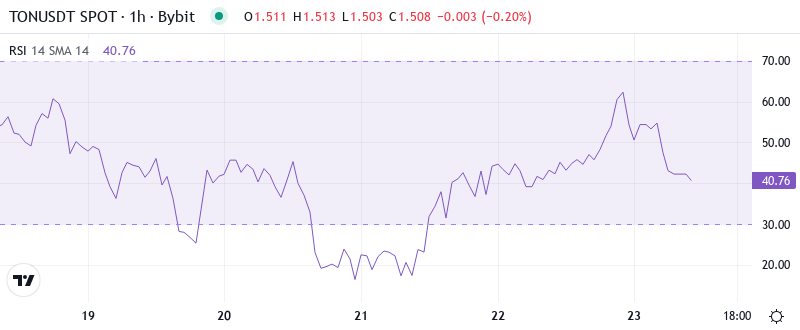
The Relative Strength Index (RSI) is a momentum oscillator that measures the speed and change of price movements. RSI oscillates between zero and 100. Traditionally and according to Wilder, RSI is considered overbought when above 70 and oversold when below 30. The daily RSI measures the speed and change of price movements. The RSI typically oscillates between 0 and 100. This product was formally known as the Market-Maker.
It is notable how RSI acted throughout the decline, it didn’t come close to overbought levels even in short-lived counter-trend rallies, which indicated continuous strong sell-side momentum that barred the price from putting in any notably strong recovery. Hence for swing traders, the incredibly oversold context indicates that it may finally be time to play the contrarian, although the $161M unlocking might push the actual recovery out until those overhangs are soaked up.
ADX Climbs to 55.3 – Extreme Downtrend Conviction
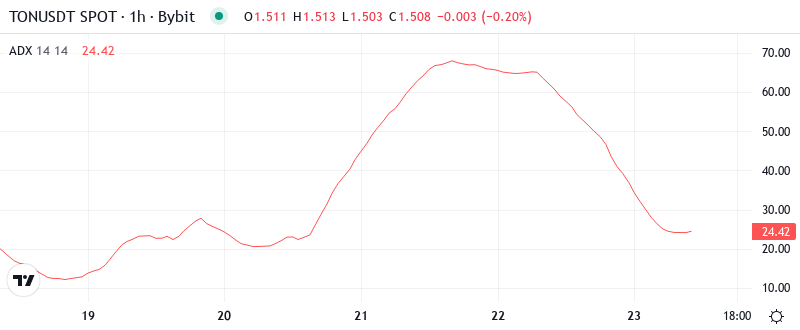
When it comes to trend strength, the ADX spiked up to 55.3, which highlights that this has been one of the most powerful directional moves in TON’s history, but also one of the most unsustainable ones. As we continue to mention, readings above 50 will often lead to situations in which the trend will get exhausted, while the momentum will remain in play longer than most traders anticipate. This, together with the deeply oversold RSI, sets the stage for a powder keg scenario where virtually any positive event could trigger the mentioned explosive relief bounce.
Essentially, the market structure implies maximum bearish outlook while maximum oversold levels are being reached. Day traders need to get ready for higher volatility as such extreme readings seldom hold – either panic intensifies into a last washout, or short-covering induces a face-ripping bounce. The Coinbase roadmap release couldn’t halt the selloff, but it gives us a fundamental context for a rebound once technicals normalize.
Price Trapped Below Entire EMA Ribbon Since November
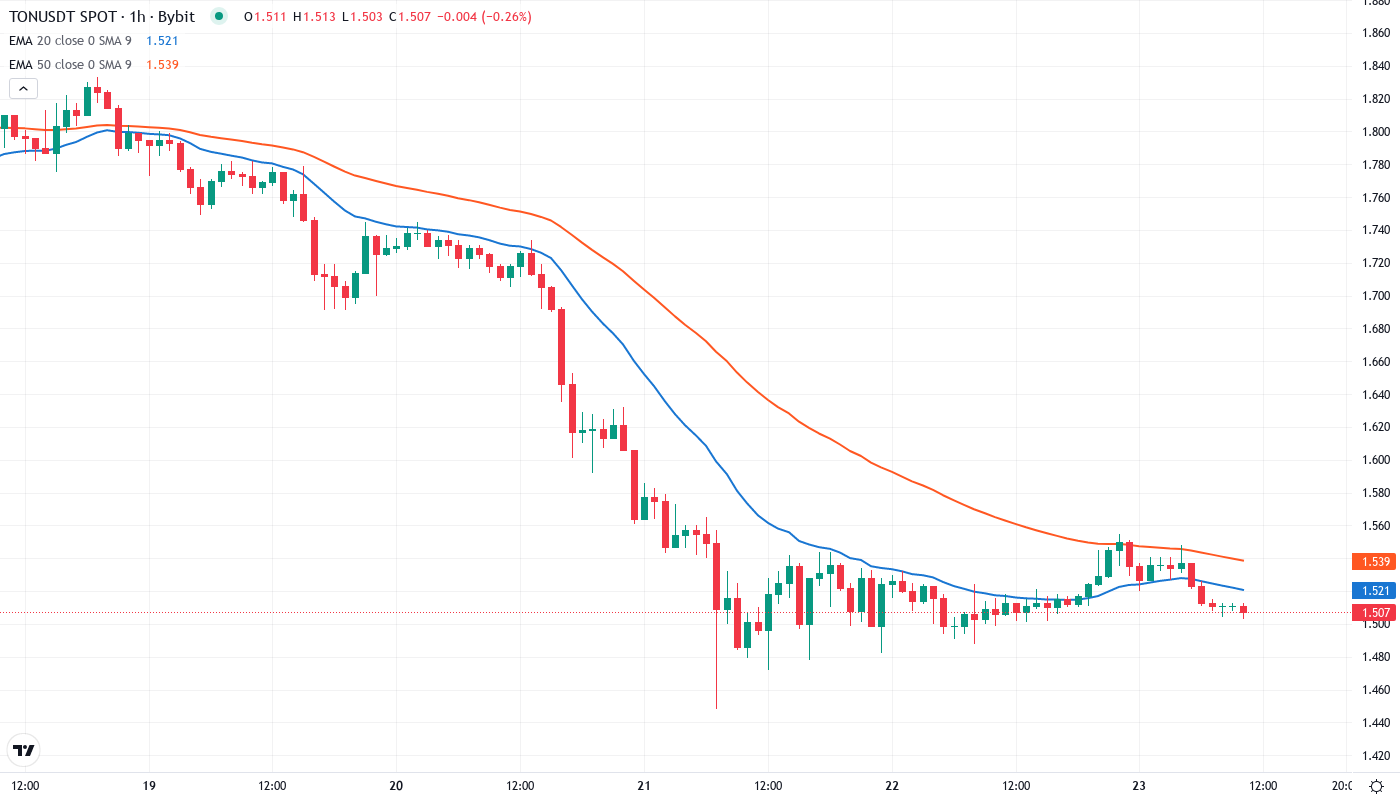
Looking at the Volume Profile Visible Range (VPVR), we see very little support beneath open trading under $2.12. There’s a brief shelf at $2.00 with a peak centered between $1.60- $1.80 The 200 EMA is the next mark of intense support, confluence with the current EMA, granting powerful technical and psychological confluence to approximately $1.50.
Even more indicative is the squeeze between current price ($1.51) and the closest support EMA – even the 10-day which is the most advance, 11% above emphasizing that the price is in a vacuum without any technical support. The air pocket below the EMAs tends to fill in a violent manner in some direction. The new CoinShares ETP release failed to prevent a new bottom, so bulls must then take $1.68 back rather than just discussing an amendment of the trend.
Support Evaporates Below $1.51 – Monthly S3 Last Defense
There is strong resistance ranging from $1.91 (equivalent to the monthly pivot) to $2.39 (corresponding to the weekly R1), as during the recovery upticks the last dime has been a wall, with larger holders happy to unload. Should prior resistance turn into support and then give way, bulls will hope that the monthly S3 at $0.94 will hold next. It is a stomach-churning 38% lower and implies roughly 50% corrective decline from the top – typical of previous crypto boom-to-bust cycles.
The bulls are trying very hard to protect the $1.51 level at which the low from November aligns with the weekly S3 pivot. This level is soaked up six daily closes thus far but with every push, it makes it less likely to hold given the number of tests. The $161M unlock came in right as the price tested this vital support level, and new supply dynamic right as the bottom might be giving way.
The market structure looks like a falling knife with relief bounces failing at successively shallower levels. This indicates ongoing distribution that will persist until either $1.51 finally sticks or the price floor gives way to the $0.94 monthly S3; and there is very little in the way of technical support to arrest a breakdown.
Oversold Bounce to $1.90 Most Probable Near-Term Path
In order to avoid getting trapped within its [0.94] weekly cycle low in late June, XRP bulls must close above 1.68. A break of the weekly uptrend would trigger a series of alarming exit signals ahead of the unfilled 1.91 monthly pivot. Weekly, daily, and intraday cycles apparently bottomed between Wednesday and Friday.
If the $1.51 support crumbles under high trading volume, the bearish trend will become a reality. This can activate stop-loss orders in a sequence which can lead to $1.20 and further to the monthly S3 of $0.94. The same situation will trap the ETP buyers and the decline will gain momentum due to a liquidity crisis.
Considering the severe oversold conditions arriving at significant support amid continued fundamental developments, the likely scenario has TON fluctuating between $1.51-$1.90 post-token unlock before pushing uptrend more convincingly in the direction of the 50-day EMA valued at $2.12.