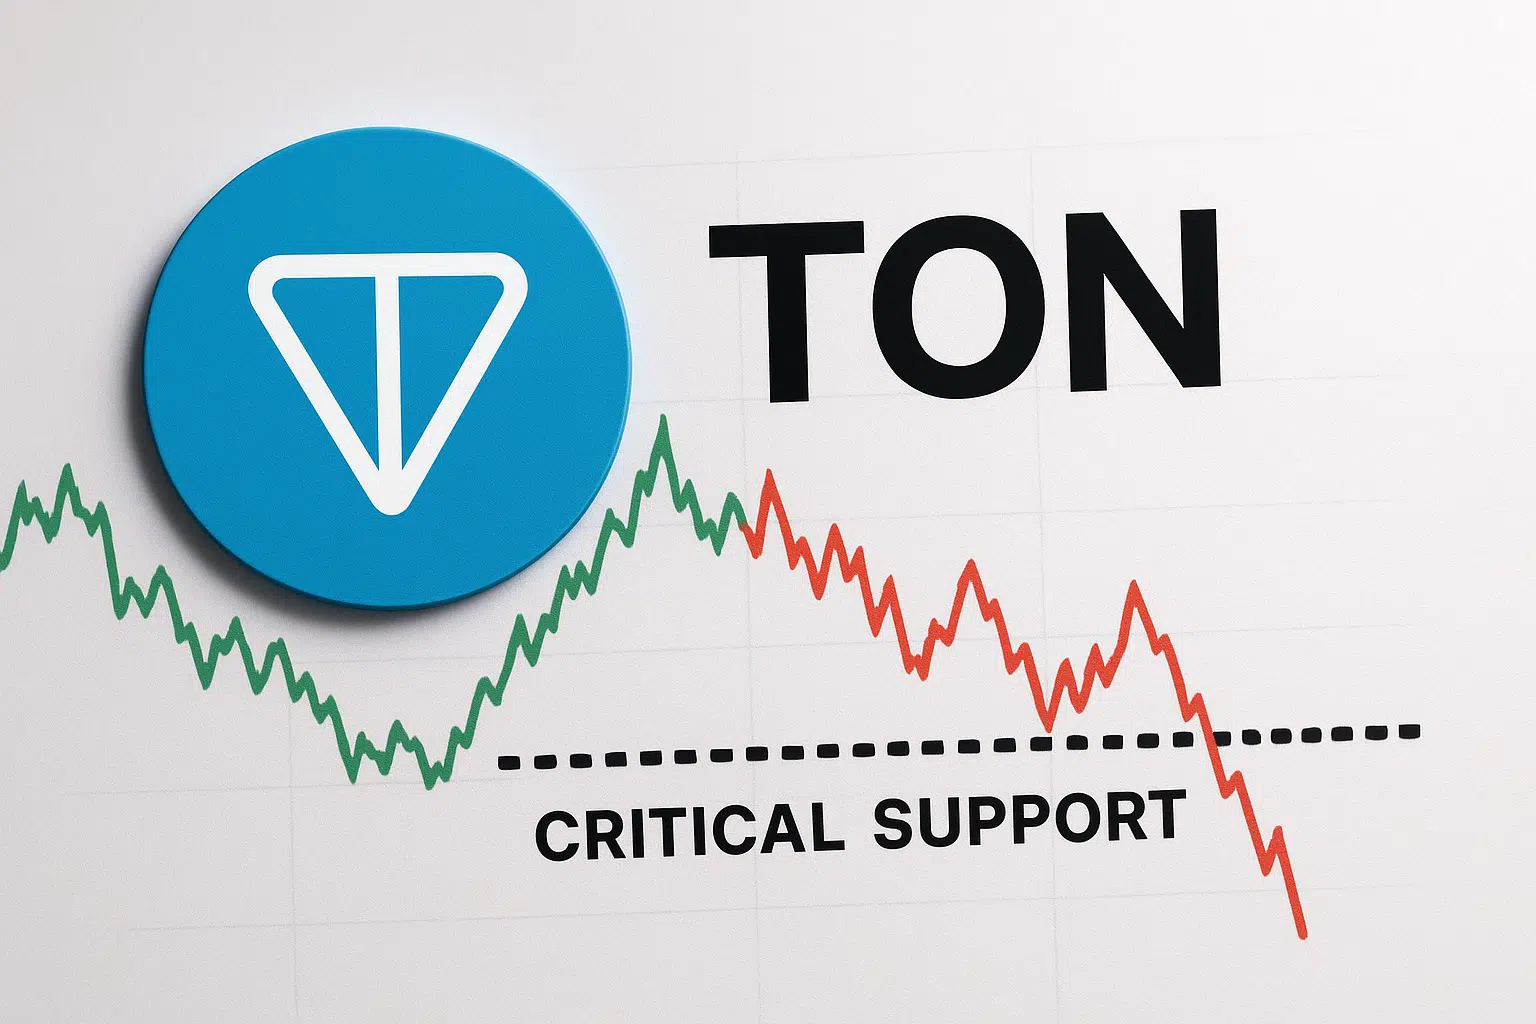
Toncoin Tests Critical Support as Coinbase Listing Roadmap Sparks Volatility
Market Structure Shifts Lower
- TON plunged 13% this week as $67M token unlock hit the market alongside Coinbase roadmap news
- Price action trapped below the entire EMA ribbon signals continued bearish pressure
- Support at $1.75 faces sixth test since November – failure here targets $1.50

Toncoin’s price action tells a tale of two catalysts colliding – the promise of Coinbase listing visibility meeting the reality of $66.95 million in token unlocks flooding the market. The cryptocurrency dropped 13.08% over the past week to $1.834, with selling pressure intensifying as newly unlocked tokens hit exchanges just as institutional interest peaked through CoinShares’ new ETP launch. The main question for traders is: can the $1.75 support level that’s held since November survive this perfect storm of supply pressure and technical breakdown?
| Metric | Value |
|---|---|
| Asset | TONCOIN (TON) |
| Current Price | $1.83 |
| Weekly Performance | -13.08% |
| Monthly Performance | -13.45% |
| RSI (Relative Strength Index) | 33.9 |
| ADX (Average Directional Index) | 49.9 |
| MACD (MACD Level) | -0.12 |
| CCI (Commodity Channel Index, 20-period) | -115.78 |
Momentum Exhaustion Signals Capitulation Phase Near Completion
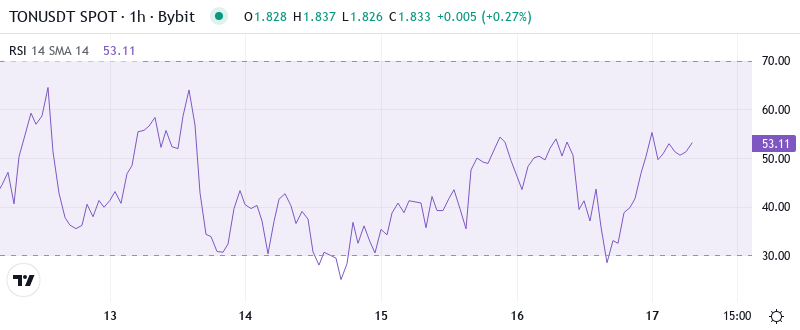
RSI sits at 33.90 on the daily timeframe, marking the first oversold reading since the August washout that preceded a 40% recovery rally. The oscillator’s sharp descent from neutral territory just two weeks ago shows how quickly sentiment flipped as the token unlock schedule became reality. What’s particularly revealing is the momentum’s failure to bounce despite the Coinbase roadmap announcement – a signal that near-term supply concerns outweigh longer-term listing optimism.
So for swing traders, this oversold RSI configuration presents a classic risk-reward setup. Similar momentum exhaustion in late summer marked significant bottoms, but the difference this time is the substantial unlock overhang still being absorbed. Traders eyeing entries should wait for RSI to reclaim 40 with conviction rather than knife-catching into continued selling pressure.
ADX at 49.93 Confirms Mature Downtrend Nearing Exhaustion

Looking at trend strength indicators, the ADX reading of 49.93 signals we’re deep in directional movement territory – specifically, a powerful downtrend that’s dominated price action since early December. At these extreme levels, the ADX suggests the selling pressure has been both sustained and conviction-driven, likely amplified by unlock recipients taking liquidity where they can find it. Basically, when ADX pushes near 50, it often marks the final capitulation phase before trend exhaustion.
To clarify, while the high ADX confirms strong trending conditions, readings above 45 historically precede sharp reversals in either direction. Day traders should prepare for increased volatility as this mature trend approaches its natural conclusion – whether that’s a relief bounce from oversold conditions or one final flush to clear remaining stop losses below $1.75.
Price Trapped Below Entire EMA Cloud Since Token Unlock Commenced
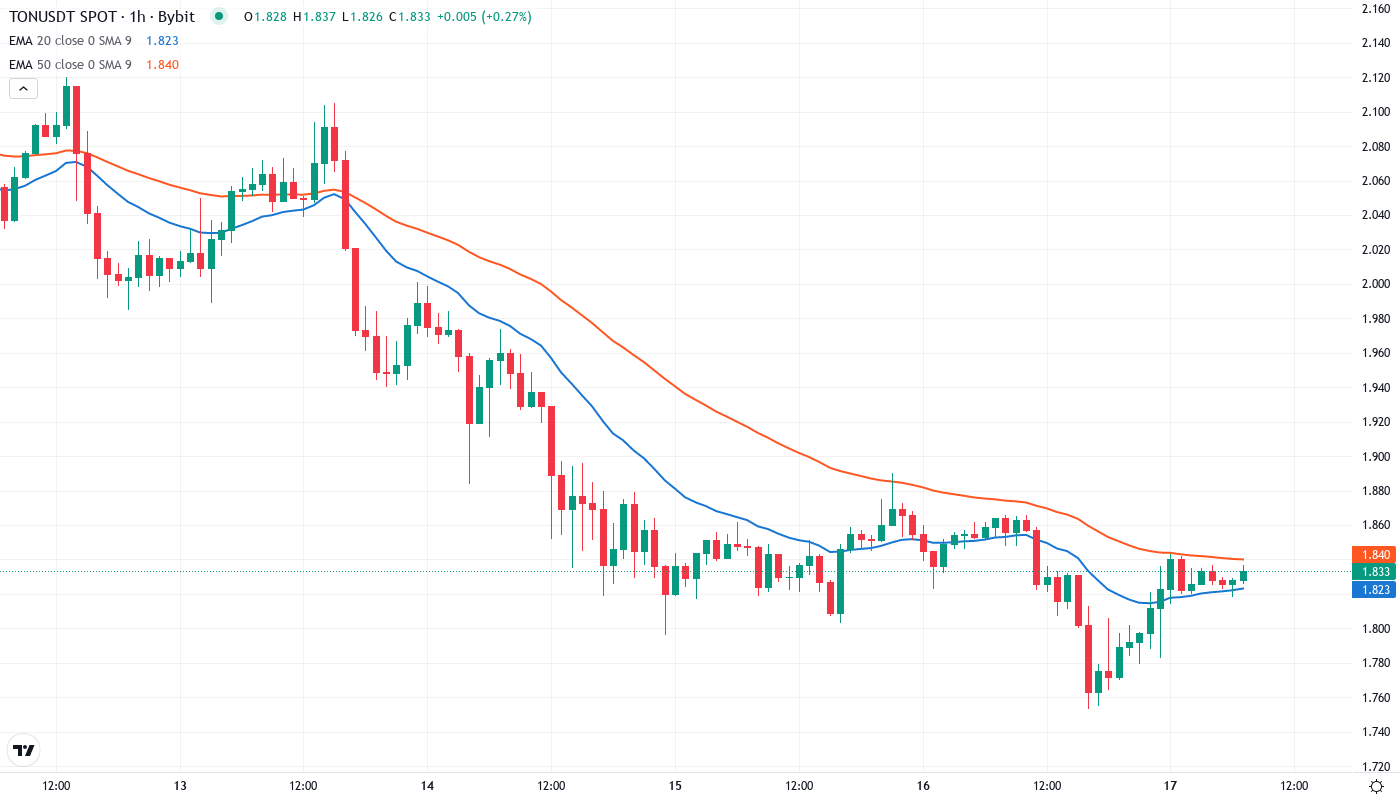
The moving average structure paints a decisively bearish picture. TON currently trades below all major EMAs – the 10-day at $1.93, 20-day at $2.02, and critically, the 50-day at $2.26. This complete bearish alignment emerged precisely as the unlock schedule kicked in, transforming what were support levels throughout November into stacked resistance overhead. The 20-day EMA’s sharp downturn particularly stands out, having rejected price attempts twice in the past week.
Most telling is the compression between current price at $1.834 and the nearest EMA resistance at $1.93 – barely a 5% gap that represents the first hurdle for any recovery attempt. Until TON can reclaim and hold above the 20-day EMA with volume, the technical structure favors continued downside pressure. The institutional ETP launch provides fundamental support, but sellers currently control the technical narrative.
$1.75 Support Faces Sixth Test as Unlock Pressure Persists
Resistance stacks heavy between $1.906 (weekly S1 pivot) and $2.036 where the 200-day EMA converges with horizontal resistance from December’s breakdown level. Above that, the psychological $2.00 level that previously acted as support now caps any relief rallies, reinforced by the descending 20-day EMA. The Coinbase roadmap announcement briefly pushed price toward this resistance cluster, but sellers emerged aggressively, defending the zone with volume.
Bulls defend the crucial $1.75 support level that’s held through six tests since November’s lows. This level gains additional significance from its confluence with the 2024 volume-weighted average price, making it a natural accumulation zone for longer-term investors. The weekly S3 pivot at $0.935 provides a disaster-scenario target, but reaching those levels would require a broader market meltdown beyond just TON-specific selling.
The market structure reveals a compressed triangle pattern forming between $1.75 support and $2.00 resistance. This 14% range has contained price action for three weeks now, with each bounce showing diminishing buying power as unlock supply gets distributed. Volume patterns suggest accumulation occurring near support, potentially setting up for a spring reversal once the unlock overhang clears.
Bulls Need Decisive Close Above $2.00 to Shift Momentum
Should price reclaim the psychological $2.00 level with a daily close above the 20-day EMA, bulls could target the 50-day EMA at $2.26 as the next major resistance. The combination of Coinbase listing anticipation and Europe’s first TON ETP could provide the catalysts needed for such a move, especially if unlock selling pressure finally exhausts.
The bearish scenario triggers if $1.75 support breaks on volume after this sixth test. Such a breakdown would likely cascade through stop losses toward $1.50, where the 2024 lows provide the next major support level. Given the ADX extreme and oversold RSI, this flush could mark the final capitulation before a more sustainable recovery.
With current momentum indicators stretched to extremes and major support under its sixth test, the most probable near-term path sees TON staging a relief bounce from oversold conditions back toward $2.00 resistance before the larger trend resolves. The token unlock overhang should clear within two weeks, potentially allowing fundamental catalysts like the Coinbase listing to reassert influence over price action.