Toncoin Tests Critical Support as $420M Investment Filing Meets 76% Yearly Decline

Market Pulse
- TON is holding near its key multi-month support after losing three-quarters of its yearly high.
- The price has lost 76% in recent weeks and just tapped the weekly support area that TON has been ranging around since early December.
- One firm clearly expects a rebound: AlphaTON Capital is reportedly organizing a $420 million raise, according to an SEC filing from last week.
Toncoin is currently valued at $1.52, reflecting a harsh 17.8% drop over the past month, and a 76% year-to-date crash. The hefty selling pressure clashes with institutional accumulation, seen its ecosystem developer, AlphaTON Capital, filing a recent $420 million registration with the SEC. The question is, will this inflow of capital be enough to turn the prevailing downtrend or will bears come out on top once again, independent of the fundamental incentive?
| Metric | Value |
|---|---|
| Asset | TONCOIN (TON) |
| Current Price | $1.52 |
| Weekly Performance | -5.87% |
| Monthly Performance | -17.84% |
| RSI (Relative Strength Index) | 38.4 |
| ADX (Average Directional Index) | 38.1 |
| MACD (MACD Level) | -0.06 |
| CCI (Commodity Channel Index, 20-period) | -155.00 |
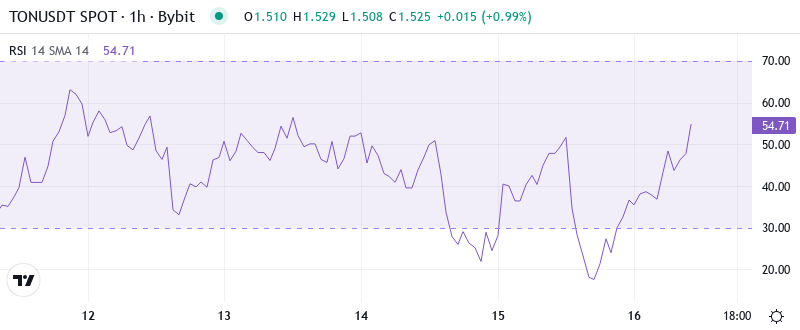
RSI Climbs From Oversold Territory as Sellers Exhaust Momentum
With crude in a freefall potentially over its head, risking less than 5% to current lows makes little sense. There are better opportunities elsewhere. For the dailies: $48.67, 41, and 39.82 on the way up.
What is interesting to note is the behavior of the RSI around the AlphaTON filing disclosure. Traditionally, positive news tends to push the RSI into overbought conditions, however this was not the case for RSI as it barely moved out of oversold regions. This shows that sellers are still in the driver’s seat even after the $420 million injection. Hence, swing traders can opt for either direction considering the equilibrium RSI, however, the lack of response to positive news hints at internal weakness.
ADX at 38.10 Confirms Mature Downtrend Nearing Exhaustion Phase
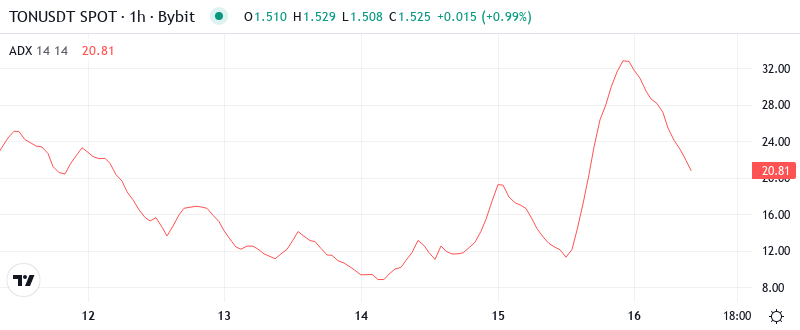
The TON trend is your friend… until it ends. This rule helps you maximize the profit you make trading an asset. The trend is likely to be in place until momentum wanes and the market changes course. To help identify market tops and bottoms, or possible changes later on, traders can use the ADX indicator.
In terms of trend strength, the strong negative trendlines are in sync with the 76% loss over the past year. However, extremely high or low ADX values very often signal a reversal. In this case, extremely low levels can indicate that we are close to the end, rather than the beginning, of a particular trend. This is the case using the ADX at the current time. The selling has been quite intense of late, but its high level suggests that the end is not far off. Therefore, contrarian traders will likely experience some dramatic price and volume swings over the short term as the ruling old trend comes to its natural and necessary death.
20-Day EMA at $1.61 Caps Rally Attempts Despite Fundamental Catalysts
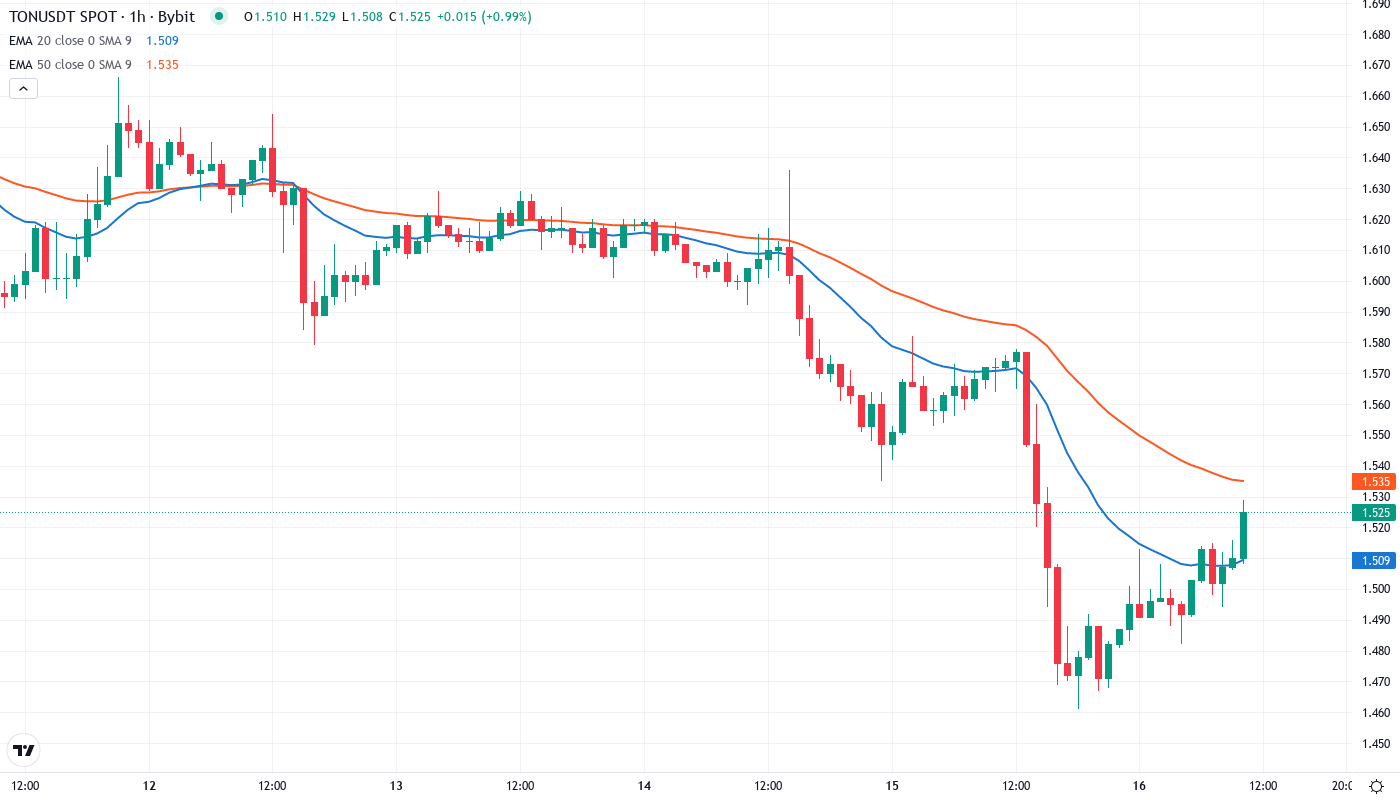
The current price action through the EMA ribbons tells us all we need to know as TON is trading below the 10-day ($1.58), 20-day ($1.61), 50-day ($1.66), and the 200-day EMA which is the most influential summative-TA average for means, methods, measurements, and metrics at $2.59, +70% from spot-prices. This hasn’t happened since the 2022 bear market bottom, which institutionalized the narrative; “structural breakdown or far too oversold”.
More importantly, this macro-support trendline has protected progress multiple times since 2016. Violent bounces (circled) with an immediate test from below occurred in 2017, 2019, December 2020, and May 2021 (very light green dotted trendline barely visible at these levels). Obviously, local trend resistance (and the 10-day EMA/50-day EMA bear cross for that matter) must break before meaningful gains, and historical support isn’t a buy signal alone.
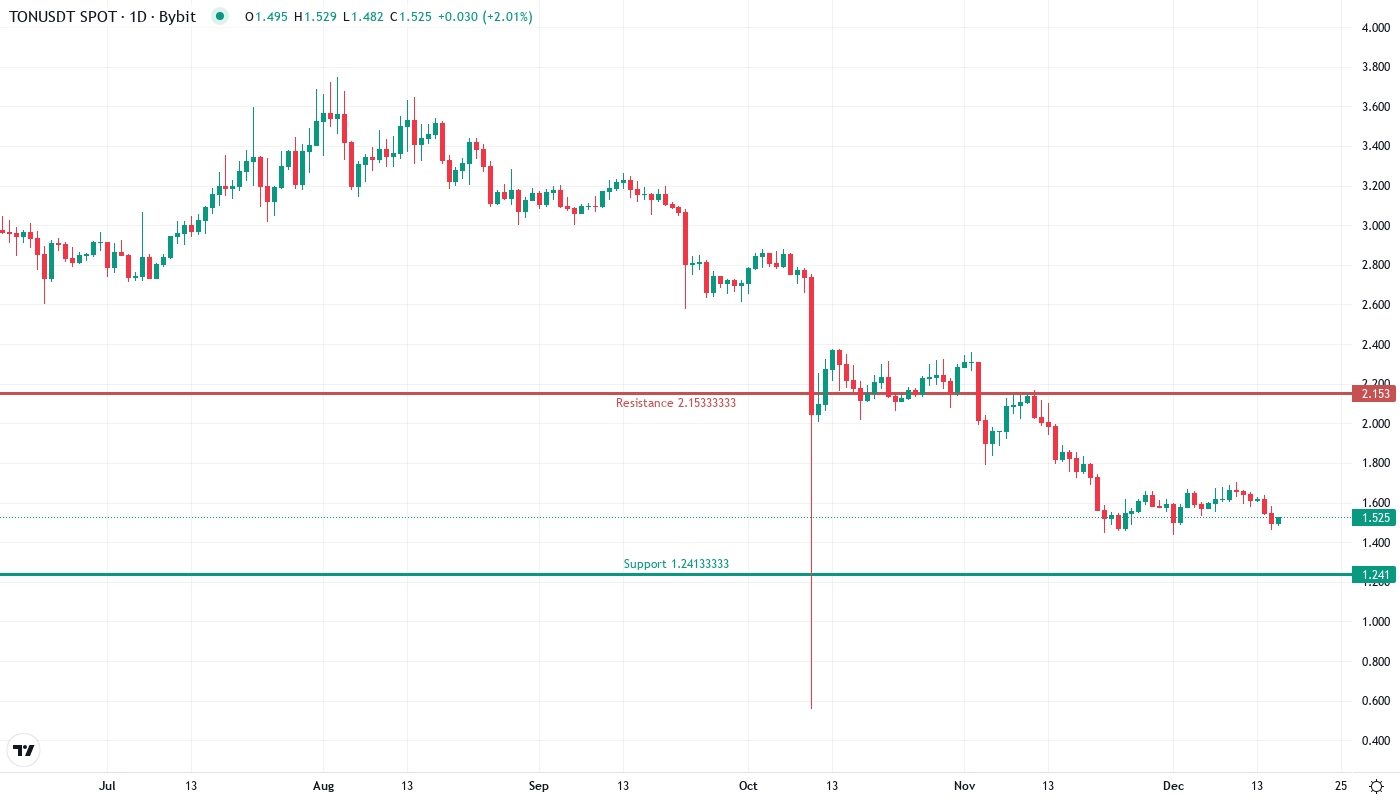
Support at $1.44 Holds Through Six Tests as Resistance Stacks Above $1.80
There is strong resistance packed tightly between the monthly pivot at $1.80 and the November low breakdown point that stands at $2.15, which will limit any bounce. The $420 million investment announcement for a moment drove price up towards $1.62, however, the 20-day EMA capped the advance, underscoring in a bearish track how technicals take precedence over fundamentals. A break crosswise over the 20-day EMA will meet obstruction at the low weekly point which is currently seen at $2.71.
Those looking to accumulate should be mindful of potentially being unable to enter if price levels never revisit these lows. Above current levels, the next resistance stands at $1.85 – any significant news could drive price above this range, similar to how traders front-ran the 1450 BTC purchases last September.
The market structure is showing an oversold bounce try to develop, with greater lows on the four-hour time span without precedent for weeks. Extraordinary oversold readings, develop downtrend exhaustion signals, and huge institutional support situate this present coin’s potential gain as overflowing with the upside. In any case, this stays a theoretical position until cost reclaims and applies over the level at $1.61. This preeminent cost point can’t be overemphasized. This denotes the uneven trigger levels ordered by the past on the off chance that they are met, long-haul advances considerably more noteworthy affirmations.
Institutional Backing Meets Technical Resistance in Critical Test
In order to confirm that the bounce resulting from an oversold situation has strength, bulls need a daily closing price above the 20-day Exponential Moving Average standing at $1.61. The subsequent significant goal would be $1.80, coinciding with monthly resistance. In this scenario, continued positive stimuli could be the expansion of the Telegram wallet in Uzbekistan and the TON ecosystem supported by the $420 million, but such a turnaround would first need to be verified at a technical level.
If the support at $1.44 fails, this will activate the bearish scenario with increased volume accelerating the velocity of the decline and potentially establishing an air pocket to $1.20, and even $1.00 psychological support. This demonstrates that not even substantial institutional buying interest can counteract the technical downturn, and it will likely lead to another round of capitulation of late buyers that bought the AlphaTON pump.
Considering how oversold the market has become and that an incredibly strong fundamental development has coincided with this, the path of least resistance in the very short term is likely for the market to consolidate in the $1.44-$1.61 region. This will give participants time to adjust to the idea of a $420 million ecosystem. An impulse wave of selling doesn’t typically reverse instantly. The tipping point is discovered when it does, and no matter how strong the selling, there is always a specific point that ends it. Similarly, the TON might consolidate for a month. Or, we could become attracted to bargains sooner. As you will have heard me say countless times before, the predominant factor is staying active and being ready for anything.