Toncoin Plunges Below $2 as Institutional Products Fail to Halt 19% Monthly Slide
Market Structure Shifts Lower
- The TON Crystal (TON) price has struggled, marking a steady downtrend over the past month.
- Lower prices failed to attract significant buy-side interest.
- Sellers remain firmly in control of the market.
The TON Crystal (TON) price has struggled lately. Despite several positive developments, the past month has been marked by a steady downtrend. The lure of lower prices has failed to attract significant buy-side interest, with sellers firmly in control.
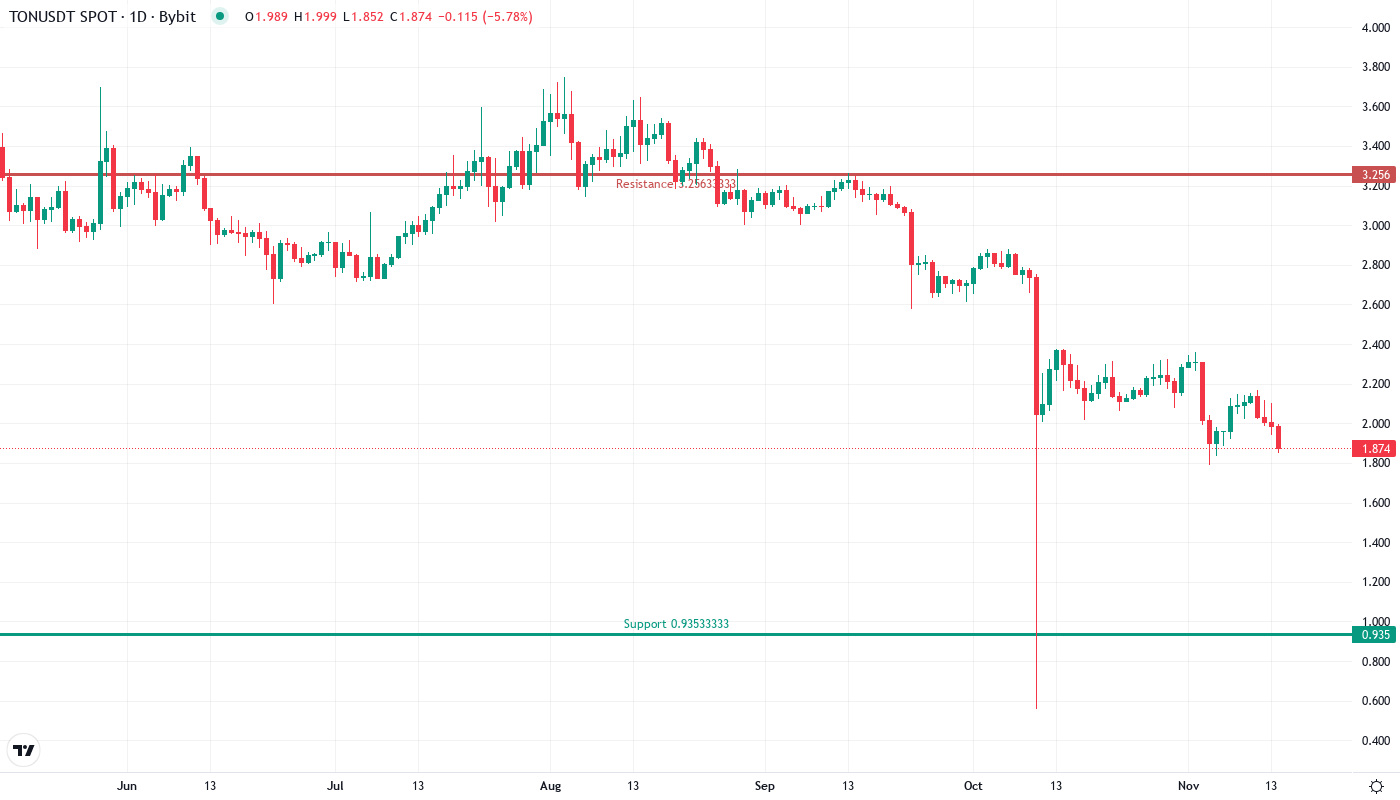
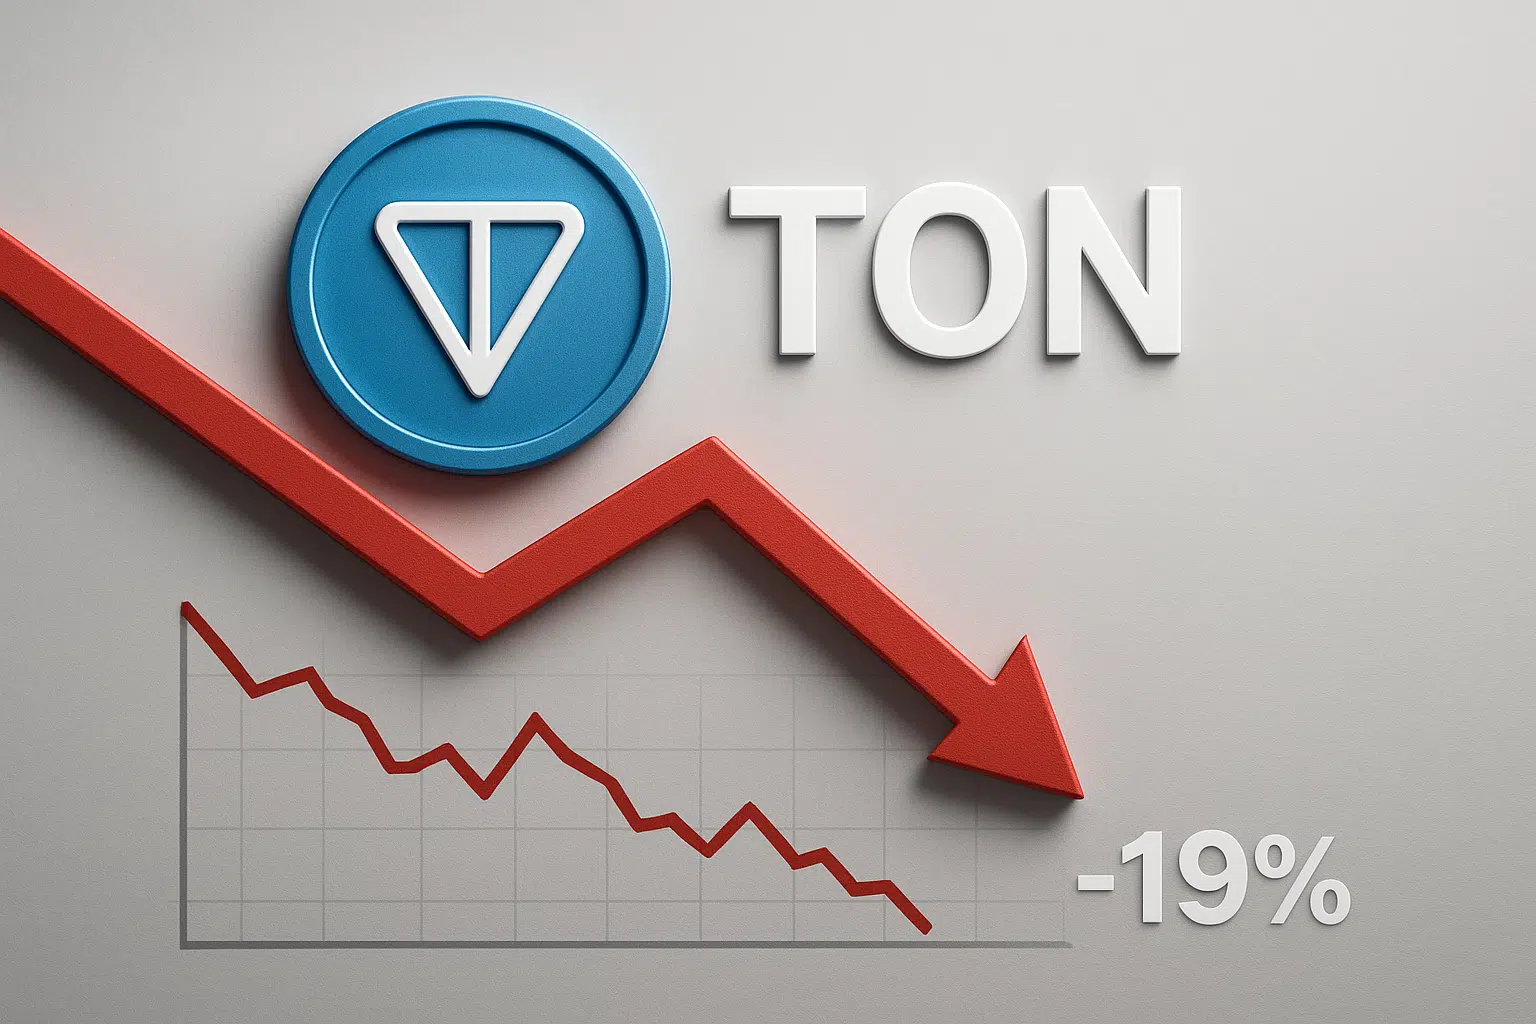
The descent of Toncoin intensified this week as the digital currency lost another 5.26% to finish at $1.856, putting it down 19.4% over the past month. This decline has come in the face of the recent creation of Europe’s first Toncoin investment ETP by CoinShares and TON being added to Coinbase’s respected watchlist – news which should have provided some tailwinds, however, it instead appeared that buyers wisely took profits and institutional sellers entered the market fearing a repeat of Nasdaq’s recent reprimand of Telegram’s undercapitalised financing. The question on most traders’ lips now must be: Will TON’s key psychological level around $1.80 act as support, or will the price head even lower to the $1.50 region, where the majority of volume traders expect institutional buying to step in?
| Metric | Value |
|---|---|
| Asset | TONCOIN (TON) |
| Current Price | $1.86 |
| Weekly Performance | -5.26% |
| Monthly Performance | -19.37% |
| RSI (Relative Strength Index) | 32.9 |
| ADX (Average Directional Index) | 48.9 |
| MACD (MACD Level) | -0.10 |
| CCI (Commodity Channel Index, 20-period) | -128.66 |
RSI at 32.9 Signals Oversold Territory – But No Bounce Yet
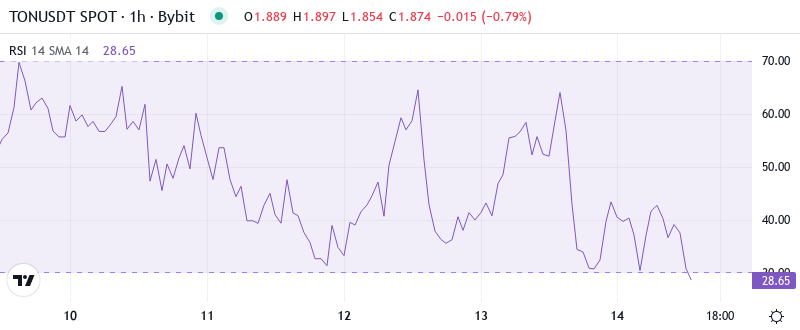
The relative strength index currently sits at 32.92 on the daily timeframe, firmly in the oversold territory where contrarian buyers typically emerge. However, the oscillator has shown no signs of curving higher and has instead been grinding sideways near these depressed levels for the third consecutive session. Perhaps most telling is how the RSI responded to the CoinShares ETP announcement. Rather than the news of a potential inflow of institutional capital serving to catalyze a momentum recovery, the RSI failed to even move above 33 after the news hit, indicating that sellers were seemingly in control even in the face of constructive catalysts.
Comparable oversold conditions in September led to a 15% relief rally over five trading days, though that setup did include the sort of bullish divergence currently lacking today. Weekly RSI (relative strength index) certainly doesn’t paint a pretty picture either at 29.89, which is the most oversold TON has been above the daily timeframe since the ‘March 2023’ washout. For swing traders, the extreme oversold condition offers potential bounce plays, although, again, tight stops are necessary with the absence of momentum divergence.
ADX Climbs to 48.9 – Extreme Downtrend Conviction
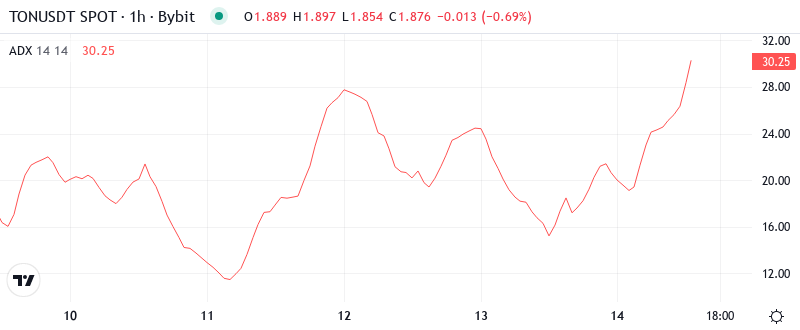
When you factor in the month-long walk lower that followed June’s highs, coupled with an oversubscribed listing (allocations as low as 5% of applications), and even reflect on the broader speculative crypto mania, it’s easy to make the point that nothing about the current unwind looks overdone. The straight-line dropouts are usually simple to recognize once the dust settles – fake-outs, head fakes, and volatile floors tend not to track down with the prevailing wind in quite the same fashion. The entirely predictable collapse of the $1 trillion PS ratio crew proves this without a doubt. However, this dust is anything but settled.
Simply put, all bounces are suspect until proven otherwise. This doesn’t mean you can’t play rallies, but rather that your upside expectations should be managed and your trading times horizon shortened.
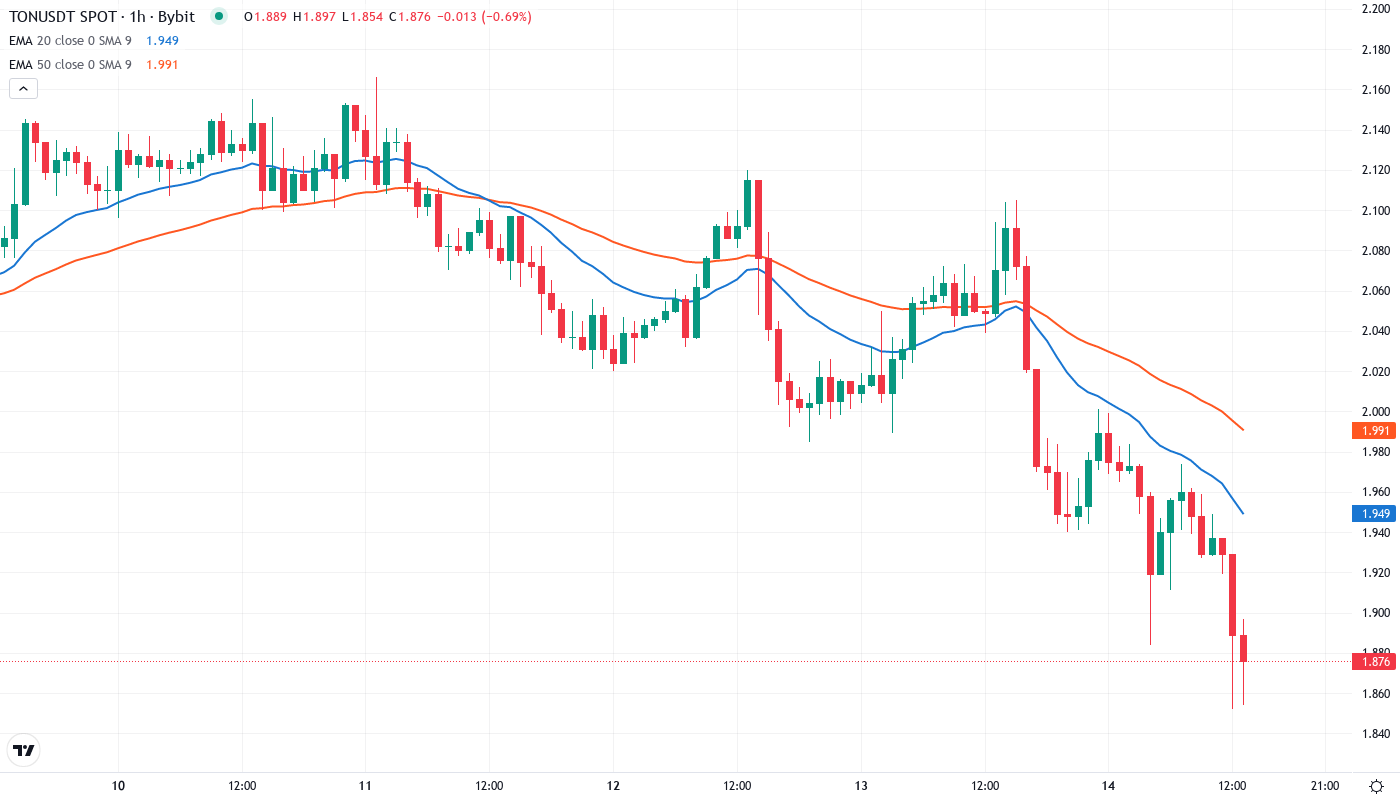
Price Trapped Below Entire EMA Ribbon Since December
The Relative Strength Index (RSI) on the daily timeframe printed a lower high in overbought territory, leading to a sharp bearish divergence soon to break sub-50. This pattern often catalyzes a cascade effect as swing traders book profits, triggering automated stop-losses and forcing other leveraged positions liquidate, creating a domino-like selloff. TON’s macro RSI is now at 52. The histogram on the daily MACD is about to flip red after a month, with the squat bearish structure likely to start showing teeth again. Standard MACD for crypto 12,26,9.
A very concerning aspect to the weekly chart is the disastrous cross between long-term EMAs 50 (yellow) and 100 (green), which both slipped beneath the 200 (red) throughout November. This Death Cross condition has been especially deadly effective on TON as both EMAs 50 and 100 rejected price during that doomed retest of $5.75 on 27 November.
Support Evaporates Below $2 as Monthly Pivots Align Lower
Sellers have placed considerable resistance above the current price, ranging from $2.02 (10-day EMA) to $2.40 (monthly pivot R1). This forms various obstacles for sellers to overcome in order to recover. Additionally, the $2.00 psychological level that provided support for six months was broken last week. Re-tests to solidify resistance were unsuccessful as they were accompanied by greater volume, this is typical behavior that new buyers are stuck in as they anticipated a rebound.
Bulls are trying to protect the $1.80 level, as this is their last stand before prices near the yearly low of around $1.50. The monthly pivot point is currently located at $2.09, which is too far up from the current price. The 20-day EMA is also located close to this level, forming a confluence of resistance. On the downside, there is a massive void on the volume profile between $1.80 and $1.50. If the price slips below the $1.80 level, the air pocket could easily drag it down further.
Importantly, the market structure indicates sellers are in control until bulls can retake and defend above $2.00 on a daily basis. The weekly support of $1.79 already had one exploration this past week, and the more it’s tested, the greater the chances of support failing, especially as institutional attitudes have turned negative following the Nasdaq rebuke which has more impact than the positive ETP news.
Bears Target $1.50 as Regulatory Clouds Darken Outlook
If the price can go above the psychological level of $2.00 and close above the 10-day EMA of $2.02, bulls will aim at $2.32 (50-day EMA), with momentum from the new Coinbase listing hopefully helping to get there. Moreover, RSI divergence on a retest of the recent low would put the odds in favor of the long traders.
If the $1.70 fails to support on a further correction, it would confirm that a major top is in, with momentum players quickly reversing once the 50-day EMA is lost. A strong bounce is then likely from $1.50/47 where a new pain threshold is found.
Because the readings are really extreme according to powerful downtrend momentum we’re seeing, the most probable near-term path is that TON grinds between $1.75-1.90 as it works off those really extreme oversold conditions before the next directional move – and with that, the risk remains to the downside until we get some regulatory clarity.

