Theta Network Tests Critical Support as Legal Turmoil Meets Technical Oversold Signals

Market Structure Shifts Lower
- THETA down 25.5% in a month amid legal action and Binance delisting.
- RSI falls to 36.9, signaling first oversold since August capitulation with possible support at $0.254.
- Strong downtrend (ADX 51) nearing exhaustion; key resistance at EMAs around $0.28–$0.30.
THETA’s price action has turned bleak this month, the worst performer among our top twenty-five projects by market cap with 25.5% losses trailed only slightly by AAVE at -20%. Substantial large wick swing lows have put THETA in the clutches of…
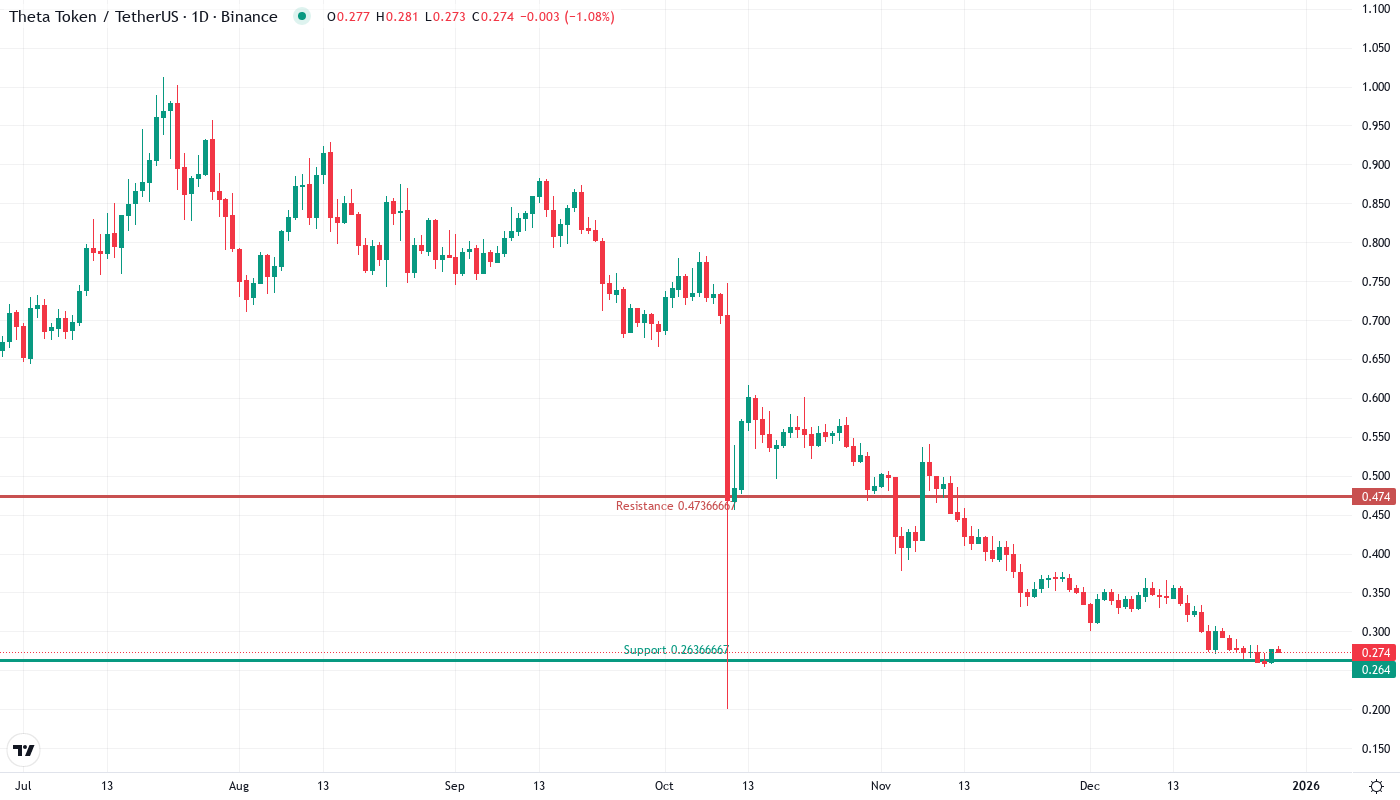
Theta Network has experienced a series of negative events recently, and the price of THETA has dropped by 25.5% to $0.275 over the last month, as legal action against Theta Labs adds to the pressure from Binance’s recent announcement that it will delist Theta’s perpetual contracts. Over the past half-year, the coin’s value has fallen by more than 60%, giving up all its gains from the 11-month long 2020-2021 bull run. Now the oversold conditions have appeared in the momentum for the first time since the August margin call across the markets. The question then for traders remains: will oversold conditions lead to a relief rebound, or is there still room for the price to go down based on the current reality?
| Metric | Value |
|---|---|
| Asset | THETA NETWORK (THETA) |
| Current Price | $0.28 |
| Weekly Performance | -5.82% |
| Monthly Performance | -25.47% |
| RSI (Relative Strength Index) | 36.9 |
| ADX (Average Directional Index) | 51.0 |
| MACD (MACD Level) | -0.03 |
| CCI (Commodity Channel Index, 20-period) | -65.14 |
RSI Drops to 36.86 – First Oversold Signal Since August Capitulation
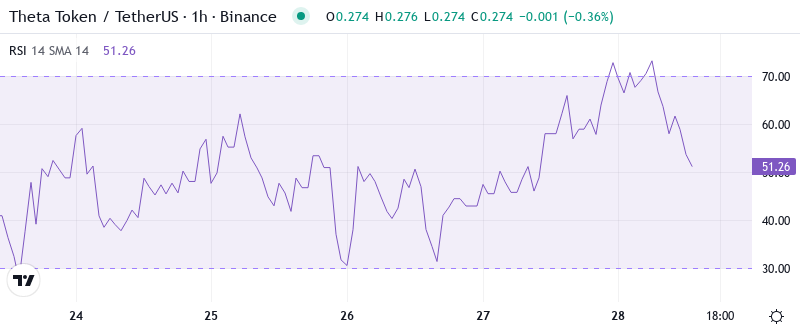
With the oscillator flashing oversold conditions this early into the move, it implies there’s another shoe yet to drop. A reading of -13.67 would clue into a washout if not an outright capitulation – THETA’s all-time low on the oscillator is -15.7, essentially levels the project printed in response to the Binance news. This scenario keeps downside risks alive, actively probed out to 15c by the washout wicks. Punctuated at two intervals along the way; first by ladder-if-size buyers at 30c who look to double-up positions below these prior lows, and again adjacent to quarter-sized bids layered as close to psychological as they can. Therefore, if the spiking short volume was by hedgies unloading shares to retail and/or desperate for liquidity from a lack of option premium or soft longs exiting, there’s still plenty of room for this to fall. This could meet an uncontested bid, which will easily outpace the bids stepped in front of shorts. After all, they covered 14M shares last week with the average daily volume (ADV) at only 50k.
ADX at 51 Signals Mature Downtrend Nearing Exhaustion Point
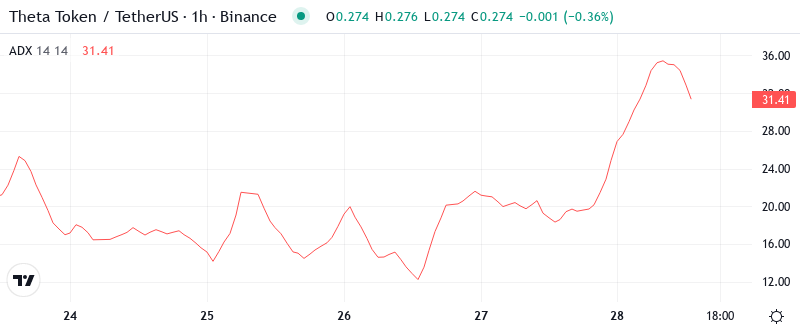
Indicators that measure the intensity of a trend show that there is confidence in this fall, but that is often unsustainable over time. An example of this would be the ADX, which when it exceeds 51 is already in an extreme zone and does not hold long. In these circumstances, entry into the ADX warns that we are facing a trend movement that is weakening or age rather than a start of a new boom. In short, when the ADX exceeds 50 in these extremes, it is often indicative that the trend movement is more concentrated to a possible exhaustion than to a continuation. Historical evidence suggests that over 90% of the time an asset, index, or market “re-tests” in the face of extreme oversold conditions and overly bearish sentiment. The difference during excessive ADX readings is that the re-test usually occurs within an accelerated timeframe, which helps to shake out any last winning longs from the prior bull trend along with many losing longs that didn’t participate in the prior bull trend.
Monthly Low at $0.254 Transforms Into Final Support Before Yearly Lows
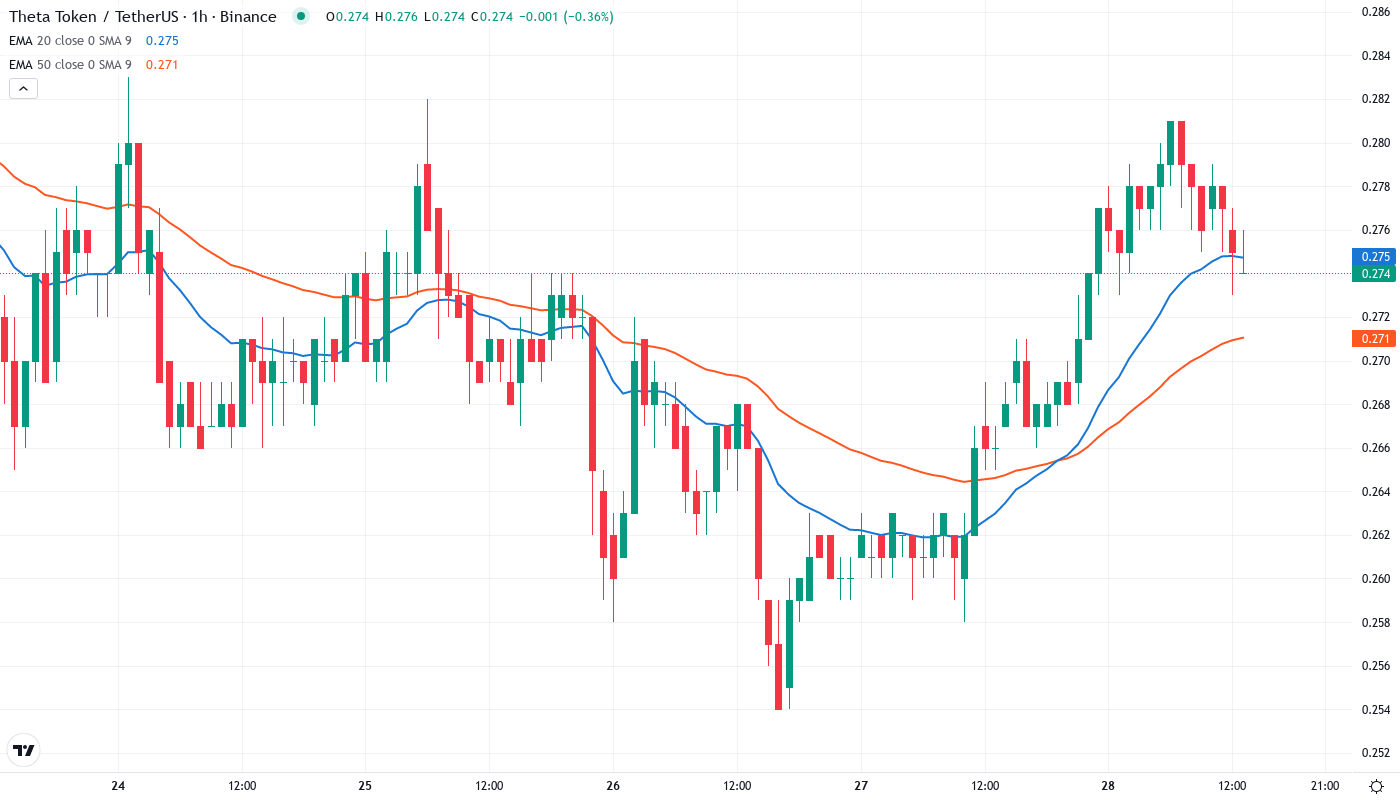
Looking ahead, should the market roll over once again, bulls will be looking for support off the November 2018 high of $0.265. That said, only $0.233 stands between bears and exchanging THETA for sub-$0.20 prices. The most striking feature of the current structure is the compression between the monthly low at $0.254 and current price at $0.275 – only 7.6% of leeway before yearly lows come into the picture. The rapid descent through all major EMAs without any pause or consolidation attempt indicates actual distribution rather than a shakeout. The former support cluster between $0.30-0.32 now presents massive overhead resistance to any relief bounce attempts.
Support Architecture Crumbles as $0.254 Becomes Line in Sand
Sellers have set up multiple resistance levels above the prevailing rates that would not be easy for a recovery to pass through. The closest one is the 10-day EMA ($0.280) while the next one is the $0.30 handle which is reinforced by the 20-day EMA at $0.298. The next critical one is the 50-day EMA at $0.358 with November’s support-turned-resistance likely to limit any relief. However, on the bright side Ripple’s XRP hasn’t given up the fight for adoption, partnering with Segasec to shield customers from malicious online content. It has been deployed by more than 12,000 businesses, according to a new Ripple insights report. Furthermore, one Norwegian news site is now requiring readers to pass a test on the XRP Ledger before leaving comments.
The market selloff is not just severe but also broad-based, with total market capitalization erasing a significant amount of the 2019 rally. The lack of security in an asset class that can seemingly shed 10-20% of its value due to one poorly capitalized event on one exchange is a turnoff to many potential long-term investors. This will take time to repair and can only really be addressed by the passage of time and the accumulation of days and weeks of positive news.
Bulls Need Decisive Reclaim Above $0.30 to Shift Near-Term Momentum
Bullish investors need to see the price gain momentum above a few key short-term moving averages. The first line of defense would be the $0.20 level and 20-day exponential moving average (EMA). After that, the 50-day EMA and psychological $0.25 mark sit just overhead to potentially cap any rips. Consecutive closes above that zone would then have my resistance from $0.28-0.30 in play. If $0.254 support at the 2019 closing low gives out, it would open the floodgates for more weak hands and final sellers to jump ship. This event would certainly create a washout panic sell-off. This is also the Hunter target that could be sucked into the final vortex of bankruptcy. The wave cleaning, which guarantees the last bankruptcy jail, could occur with a break of $0.254 and torrent to the $0.20 area. The Fundamental mooring cords of potential settlement talks (vaulting legal fees makes settling much more prudent) could keep $0.20 firm and be Synopsis Tilray gone for good paradropping.
Given the technical oversold extremes coupled with negative underlying news, the most likely short-term trajectory is volatile consolidation within a range of $0.254-$0.30 amid oversold conditions normalizing with little to no uptrend. Theta Labs’ litigation must clear or strong partnership news emerge to counterbalance the Binance delisting blow. Rallies will be limited by resistance levels and minor supports will do little to contain the selloff.