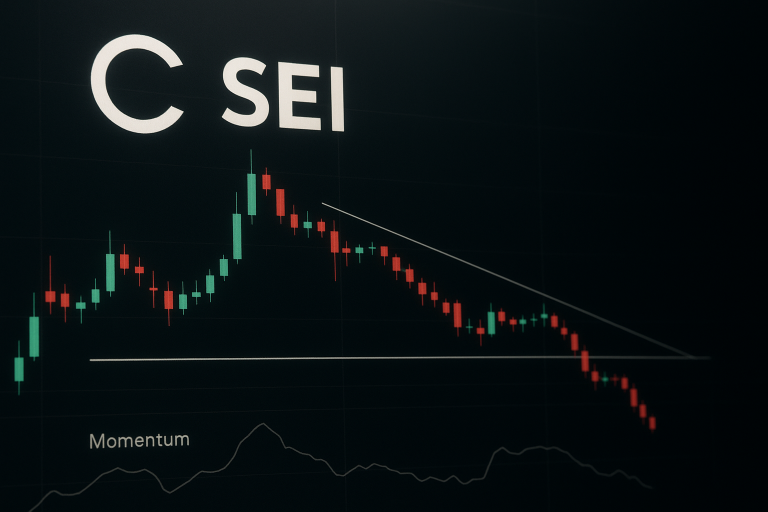
SEI Tests Critical Support as Momentum Exhausts Near Four-Month Lows
SEI’s price action tells a story of exhaustion meeting opportunity as the token trades at $0.138, marking a devastating 31.2% monthly drop that erased gains from the recent Binance and Binance.US listings. The collapse from December’s $0.202 high to current levels represents a 55% quarterly decline, though bulls now defend the critical $0.128 support that held six times since November. The main question for traders is: will institutional ETF speculation and the emerging double bottom pattern at these levels provide the catalyst for reversal, or does further capitulation await below?