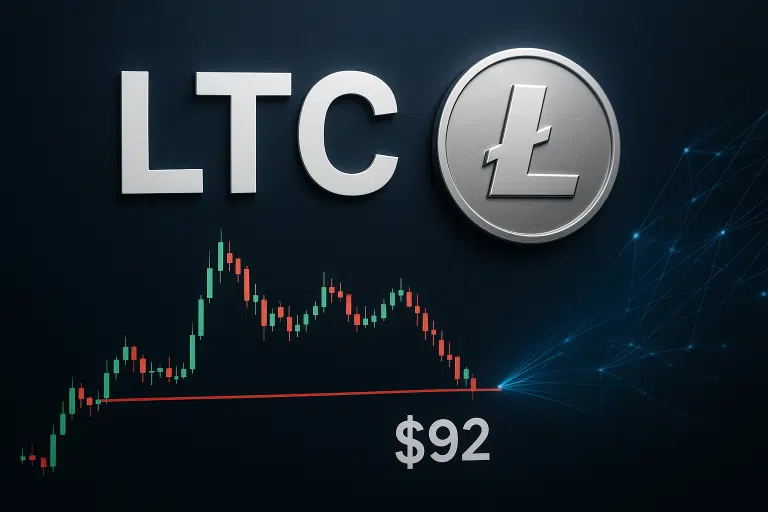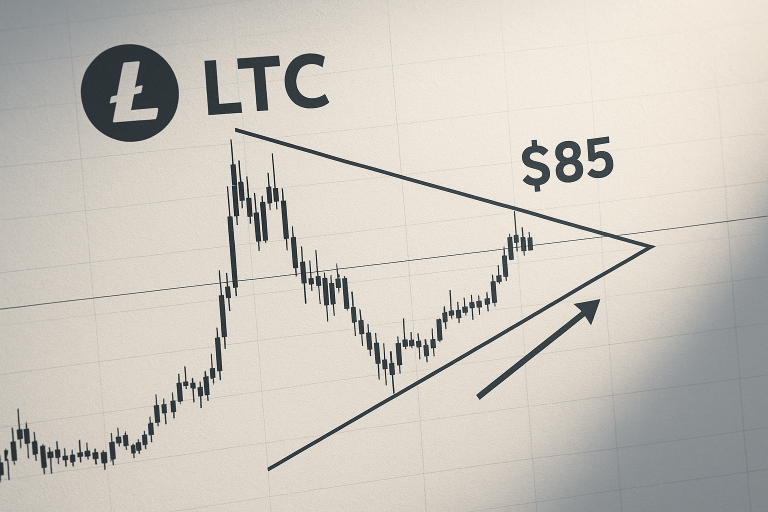
Litecoin Stalls at $85 as Multi-Year Triangle Compression Nears Resolution
Litecoin stalls at $85.01, down 13.8% this week. Has suffered a devastating drop despite 117% hashrate surge. Multi-year symmetrical triangle nears resolution. MWEB adoption hits new highs. Technical indicators flash extreme oversold conditions. Traders question if relief rally will occur or further downside is imminent.