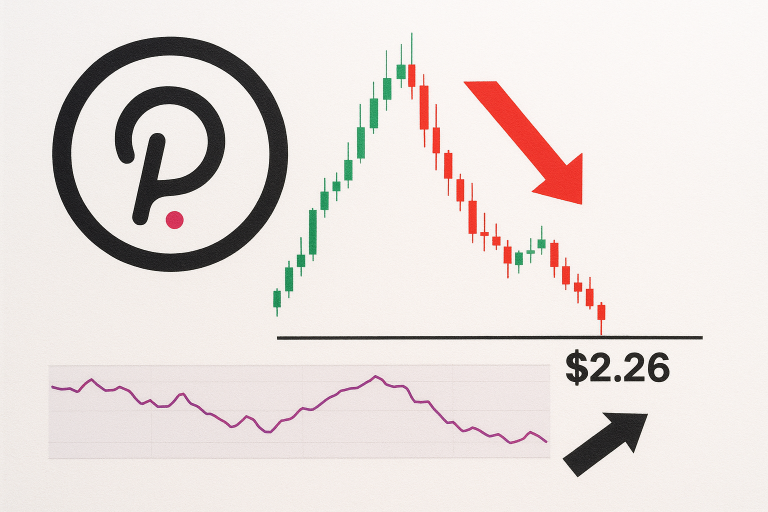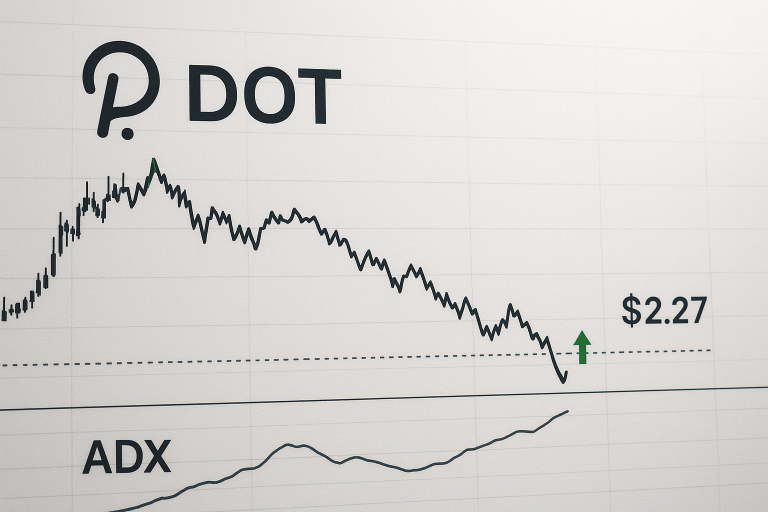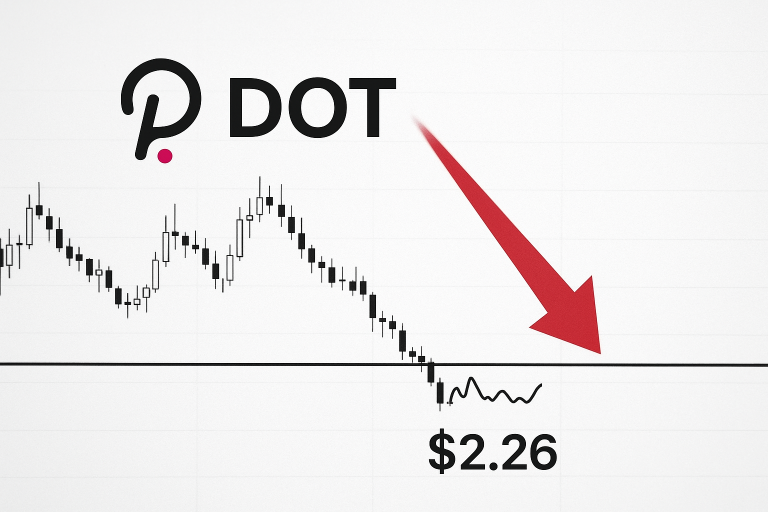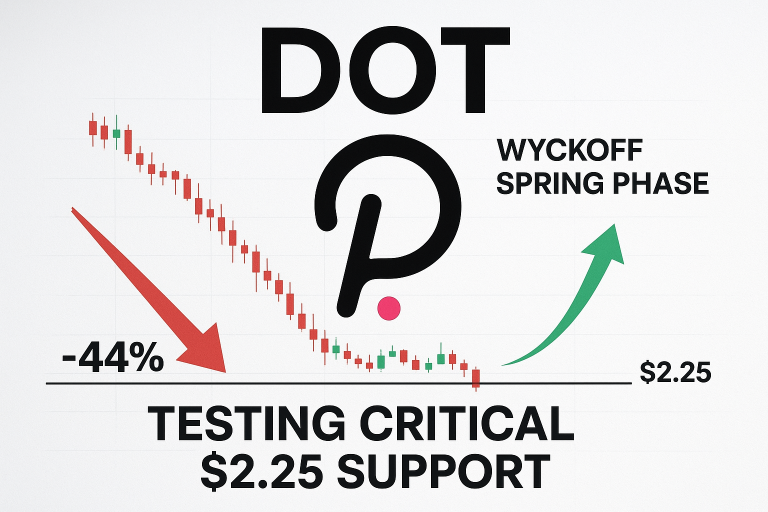
Polkadot Tests Critical $2.25 Support as Wyckoff Spring Completes Amid 44% Monthly Decline
Polkadot’s sharp decline of 44% from monthly highs has brought it to a crucial support level at $2.25. The completion of a Wyckoff Spring signals potential accumulation, as the ADX climbs. Traders await to see if the support holds or if further downside is in store.