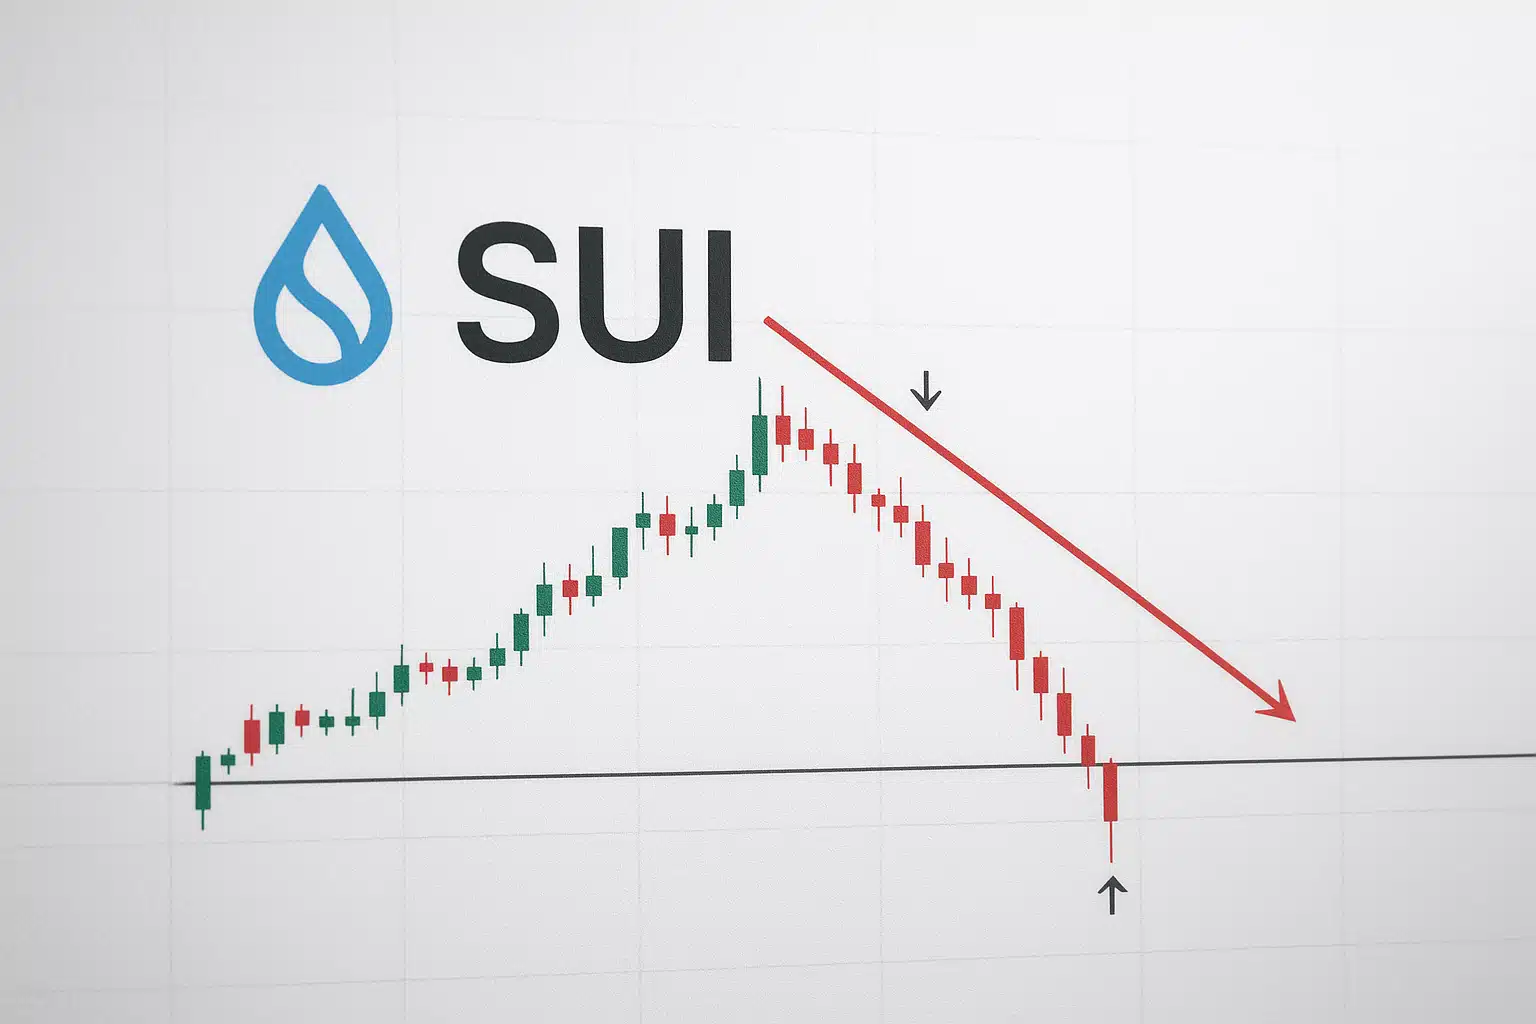
SUI Trades Near Critical Support as ADX Signals Trend Exhaustion
Market Pulse
- SUI is now priced at $2.09. It has gone down 25.5% in a week because traders are selling off their funds after the frozen funding announcement.
- Indicators are showing a strong sell with RSI at 39.1. A downtrend has been confirmed by ADX.
- The key support is currently at $1.82 but the bears are eyeing the psychological level of $1.50 which is below.
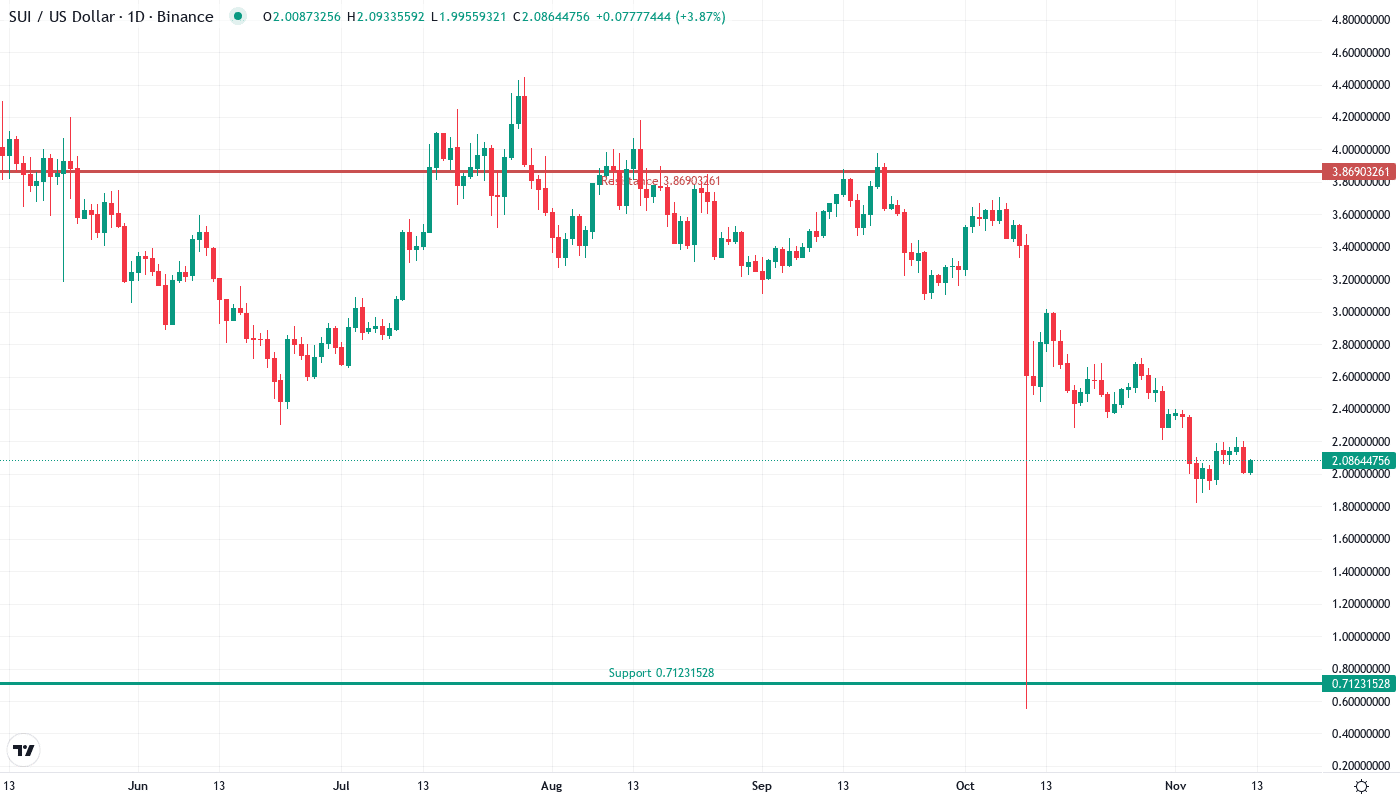
Sui’s price movements are the narratives of this week with promises broken. The token decreased by 25.5% coming down to $2.09 after the Bybit report told SUI’s ability to freeze user funds – which is just the very idea of decentralization that crypto lives and stands for. This catastrophic fall wiped another 50% of SUI’s value (it was $3.00 in just a month) and left traders trying in a hurry to make a balance on their holdings. The major question traders are asking is: does the Bluefin partnership’s $4.32M endorsement of the deal can outweigh the damage on the SUI brand?
| Metric | Value |
|---|---|
| Asset | SUI (SUI) |
| Current Price | $2.09 |
| Weekly Performance | 5.86% |
| Monthly Performance | -25.51% |
| RSI (Relative Strength Index) | 39.1 |
| ADX (Average Directional Index) | 53.9 |
| MACD (MACD Level) | -0.19 |
| CCI (Commodity Channel Index, 20-period) | -70.51 |
RSI Signals Oversold Territory
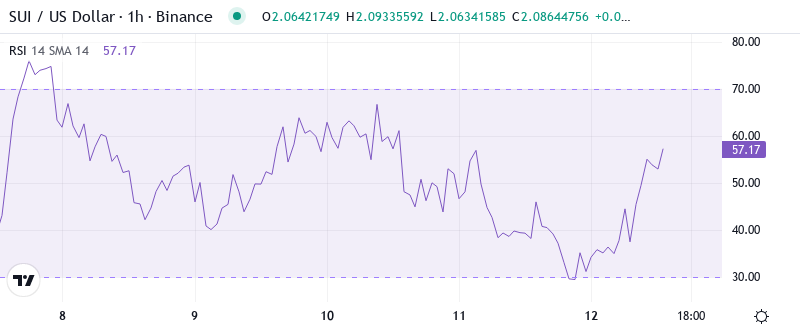
The current RSI index is at 39.1, which makes it a low level according to the daily timeframe, indicating that this situation has formed a deviation from the normal case to a kvabary list of marked capitulation. The outcome, in this case, has to be decided by the panic, which is the negative force that the report of the freezing capabilities in the wires made on the market. Traders have made great losses not even considering the price of the assets. Just like that, this RSI set up that was present in December was like a springboard for the strong price rebounds that occurred within a few days at 15-20% rates.
Similarly, this oversold RSI for swing traders is an indication of possible bounce opportunities that could put their profits at risk. However, it is important to take a closer look at the situation. The suspension of funds was not only an unexpected news but also a game-changer for SUI’s investment analysis, which is why the typical oversold cases would be way less likely to work. It is smarter to wait before the RSI goes back above 45 when the long positions are considered, as the initial breath of the wave is deleted by this condition.
ADX Confirms Downtrend Conviction
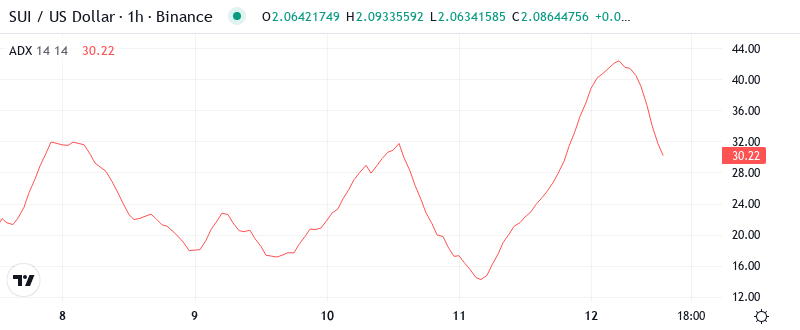
The fact that the ADX entry is at 53.9 shows that this is an extreme trend strength – when it goes above 50 it means that there are serious moves with a strong backing. Generally, being in this area is an indication that sellers are not just taking profits but they are immediately diving to the water and escaping with a great deal of force. The explosive increase from 10.97 to 53.9 within a few days is a mark of one of the most rapid trend accelerations in the history of SUI.
If you want to be more clear, the ADX adjustment is the indication that we have moved from the process of consolidation to the full liquidation mode. The Bybit report was the trigger that changed the months of lateral movements to finally allow the selling pressure, which has built up during this period, to come out. Accordingly, it would be interesting to traders that had better to use the trend strategies such as fading the rallies to resistance levels instead of buying dips until ADX retracts beneath 30.
Moving Averages Paint Bearish Picture
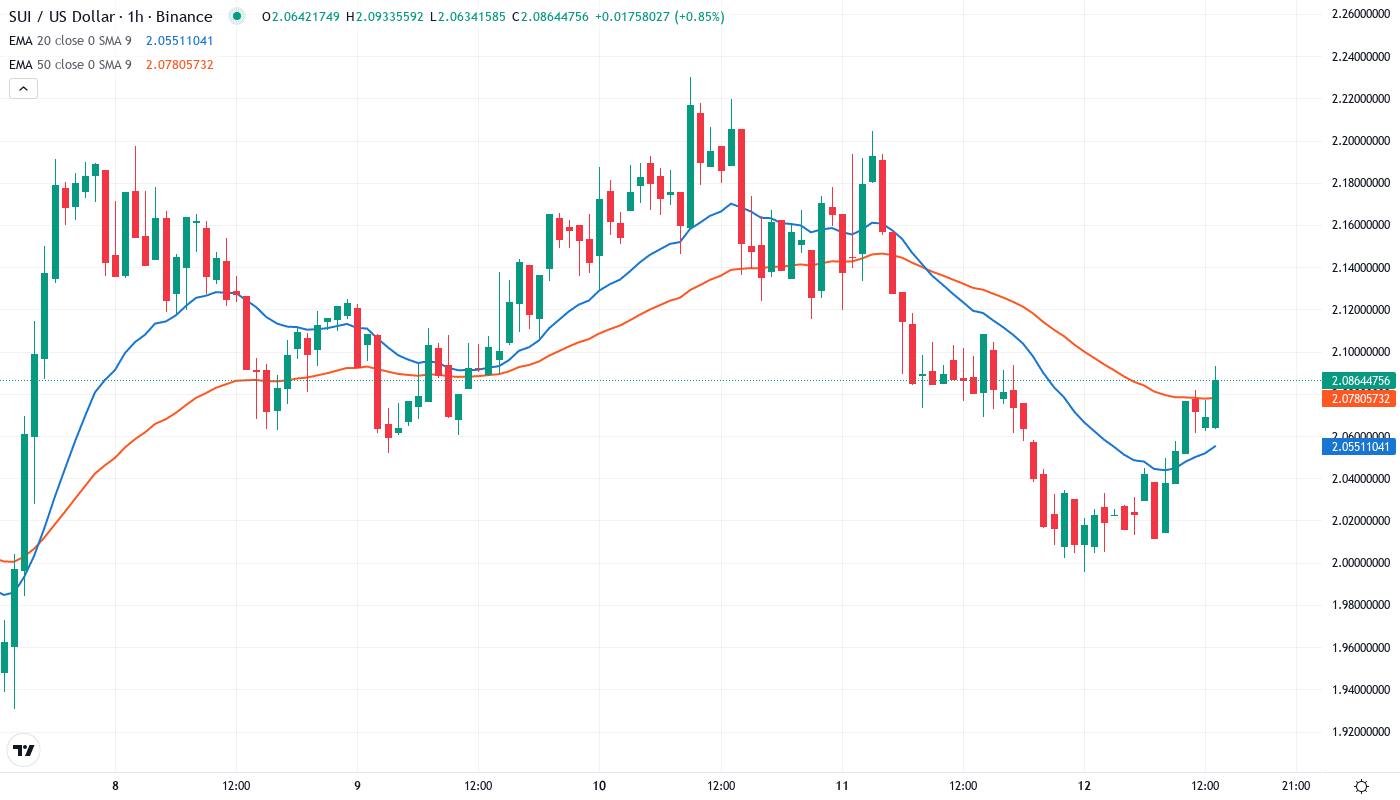
SUI is below the 10-day ($2.13), 20-day ($2.26), and the symbolically critical 50-day EMA at $2.62, making it the EMA ribbons talk. The 100-day at $2.94 and 200-day at $2.92 are just far hoovering away and have turned from magnets to distant memories in a mere period of 7 trading sessions. The total erosion of moving average support was completed as the traders reflected the consequences of the possible fund freezing.
After the price fell down through it on huge volume which the 50-day EMA became the simple moving average form for the oscillator of the MACD which is a reliable support line has turned into a solid resistance line. Sometimes this level was rejected three times by advances to it before finally breaking through it. So now it is the one who caps the recovery attempts. The previous support zone at $2.62 converts into an aggressive red line that bears defend constantly. In the absence of SUI recapturing and remaining above the 20-day EMA, the pathway of least resistance endures lower.
Critical Levels Define the Battlefield
The nearby resistance is found in the interval from $2.26 to $2.40 since the 20-day EMA joins the weekly pivot point at this level. This zone is actually the one to say no to recovery so far as the heads who could make that happen used it to take off the lightover after the freezing news. Apart from this, the gap down area between $2.60-2.65 is definitely forged with the no. 1 long entry for conditional market participants that is, their exit from the long positions.
The support structure seems more vulnerable now after the collapse of last week. The $1.82 weekly low denotes the primary defense line, although the level of assurance remains in doubt due to the fundamental change in SUI’s perceived value proposition. Underneath is the psychological $1.50 level, which is a magnet for stops if the existing support is broken.
The market structure expresses the strength of the sellers as long as the price remains below $2.26. The rapid breakdown observed, accompanied by the volume expansion, validates the institutional distribution for the most part aside from the retail panic. Each rebound is pushed back into the resistance zones, and it sets a downward staircase-shaped pattern that thus supports the further decline of the asset.
Trading the Crossroads
For the bulls, it is essential to seal a daily closure over $2.26 to demonstrate an even temporary bottom. The Bluefin partnership is the primary reason for the confirmation of the relieF rally, but it is a technical repair that will take time. If the buyers manage to break the barrier of $2.40 with a good volume, the next targets will be $2.62 where the real supply exists.
The bearish scenario will be further strengthened in case $1.82 seems to be strong support that fails, thus the market goes daily close above it. The recent breakdown suggests that traders should take note of the decline to $1.50, where they should avoid the risk of losses given that no support is level is available. Concerns over funds freezing are the major factor for selling pressure that have led institutional investors to review the level of risk associated with SUI – in fact, every news release is now a possible key factor for the decline in the company’s price.
Taking into consideration the current upward trend and the basic obstacles, it is apparent that the most probable prospect for SUI in the short term is a consolidation at the price range of $1.82-2.26, as the market absorbs the information disclosed this week before it makes a decision on the direction.