SUI Shatters Support as DEX Records Fail to Halt 60% Collapse

Market Structure Crumbles
- SUI trades at $1.55 after losing 60% from October highs despite record DEX volumes
- Revolutionary Walrus prediction markets and Travala payments integration couldn’t stop the bleeding
- Bulls defend final support at $1.55 while momentum indicators flash extreme oversold
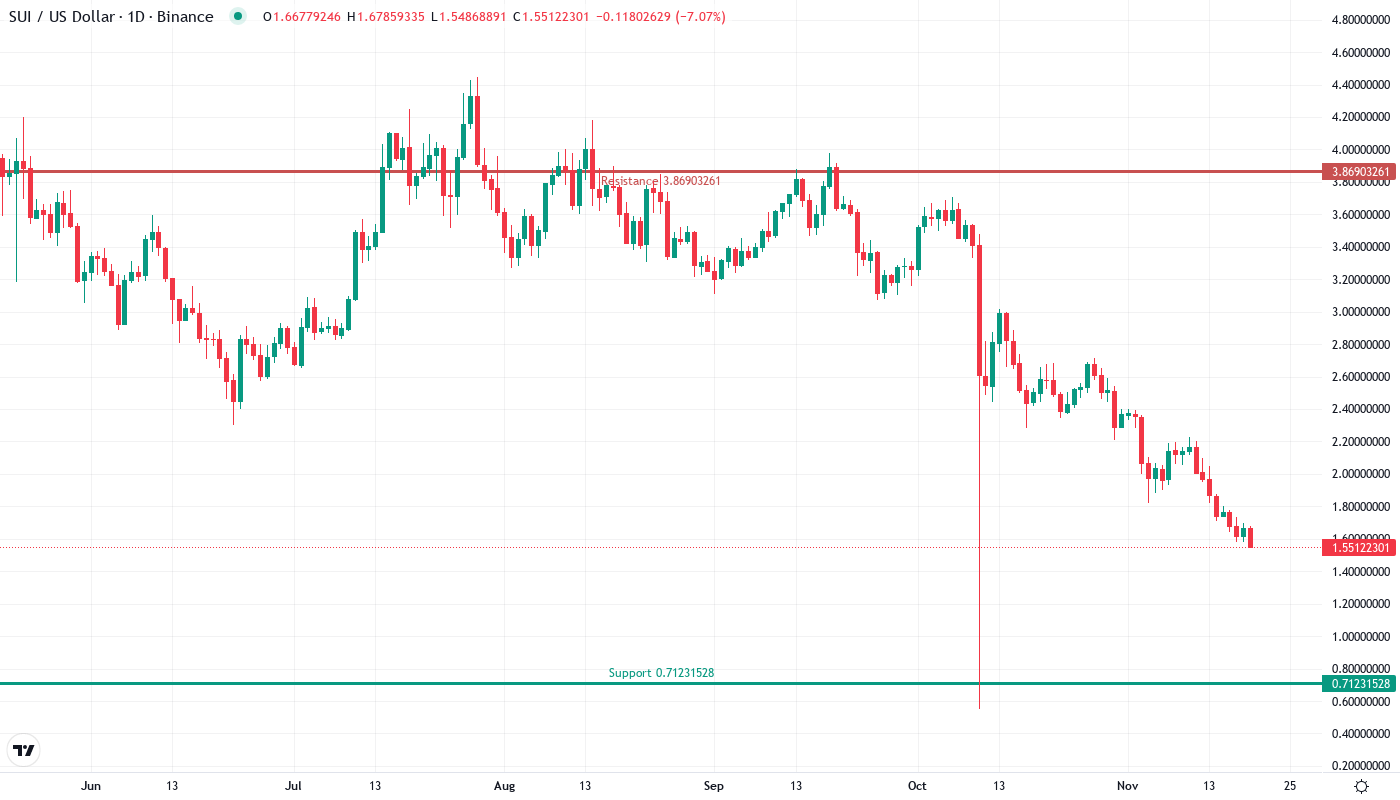
Sui’s price action tells a brutal story of broken promises and shattered support levels. The token has collapsed 60% from its October peak, currently changing hands at $1.55 despite a flurry of positive developments including record-breaking DEX volumes for three consecutive quarters and expansion into real-world payments through Travala. What started as a controlled pullback in November accelerated into a devastating drop that erased months of gains in weeks. The main question for traders is: does the confluence of extreme oversold readings and major support at $1.55 mark the capitulation bottom, or will the selling pressure that overwhelmed positive fundamentals continue to new lows?
| Metric | Value |
|---|---|
| Asset | SUI (SUI) |
| Current Price | $1.55 |
| Weekly Performance | -22.83% |
| Monthly Performance | -39.90% |
| RSI (Relative Strength Index) | 26.6 |
| ADX (Average Directional Index) | 57.8 |
| MACD (MACD Level) | -0.25 |
| CCI (Commodity Channel Index, 20-period) | -137.73 |
RSI at 26.5 Matches Levels That Marked Every Major Bottom Since Launch
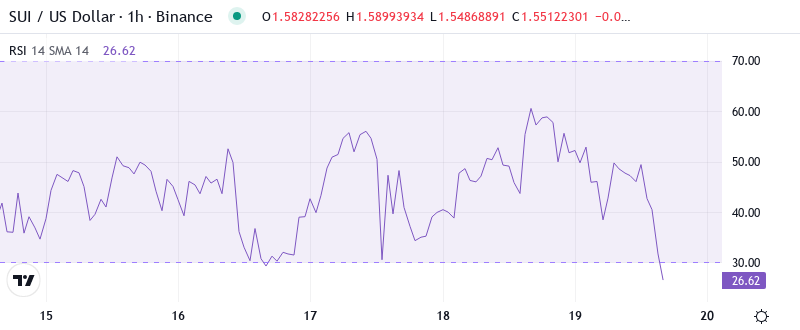
Reading the oscillator at 26.56 on the daily timeframe reveals momentum exhaustion rarely seen in SUI’s trading history. This marks the third time RSI has plunged below 30 since the token began trading, with previous instances in March and August both preceding sharp reversals of 40% or more within weeks. The weekly RSI paints an even more extreme picture at 33.72, confirming that sellers have pushed momentum to levels that historically attracted value hunters.
What’s particularly revealing is how RSI behaved during the collapse – it spent just two days above 40 during December’s brief bounce attempt before rolling over again. This persistent weakness despite revolutionary partnerships like Walrus prediction markets and being recognized among the most actively developed crypto projects suggests forced liquidations rather than organic selling. So for swing traders, this deeply oversold configuration combined with major support creates the highest-probability bounce setup since August’s 40% reversal from similar levels.
ADX Spike to 57.8 Signals Trend Exhaustion After Vertical Decline
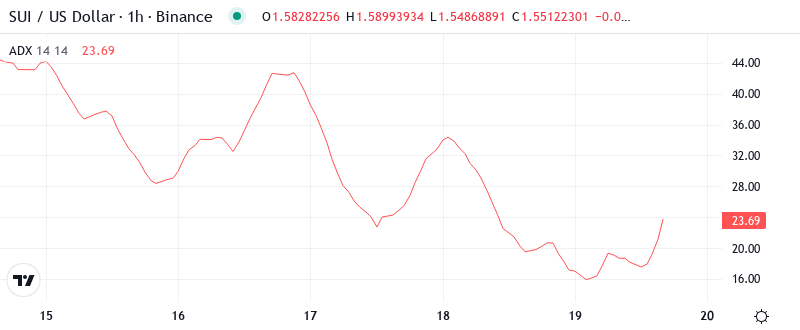
Trend strength readings have exploded to extremes with ADX climbing past 57.8, marking the strongest directional move in SUI’s history. Basically, when ADX pushes above 50, it signals a mature trend approaching exhaustion rather than continuation. The last time ADX exceeded 40 was during October’s blow-off top at $2.71, which preceded the current 43% monthly decline.
Looking at the velocity of this move, sellers maintained relentless pressure for eight consecutive weeks without meaningful consolidation. The combination of extreme ADX readings and the token sitting 60% below yearly highs suggests the panic phase of this decline may be complete. Therefore, range traders should prepare for mean reversion as ADX this elevated historically precedes periods of consolidation or reversal rather than further trending moves.
$1.55 Support Holds as 50-Week EMA Provides Final Defense
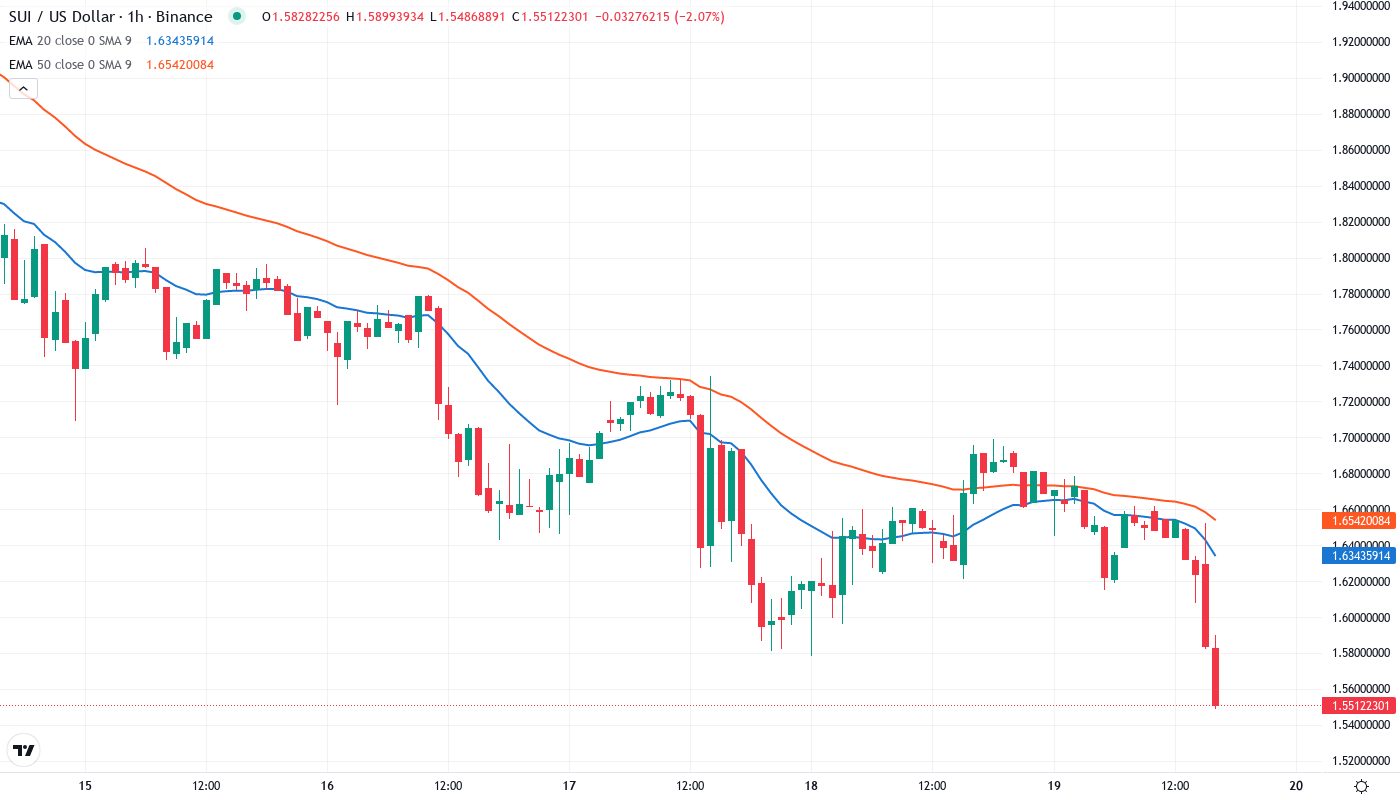
Price action through the EMA ribbons paints a clear picture of technical devastation. SUI trades below every significant moving average, with the 10-day EMA at $1.77 now acting as immediate resistance after supporting price throughout the early 2024 rally. More concerning, the 20-day EMA at $1.96 and 50-day at $2.39 create a resistance stack that bulls must overcome to signal any meaningful recovery.
Crucially, the weekly 50-period EMA at $2.76 transformed from support to resistance during November’s breakdown, confirming the shift from uptrend to downtrend on higher timeframes. The silver lining appears at current levels where price has found support precisely at the 200-week EMA confluence near $1.55. This level represents the last technical defense before opening an air pocket to psychological support at $1.00, making it a red line that bulls absolutely must hold.
Support Architecture Concentrates at $1.55 While Resistance Stacks to $2.70
Resistance clusters heavily between $1.93 and $2.76, creating multiple barriers for any recovery attempt. The immediate ceiling sits at December’s bounce high of $1.93, which aligns with the monthly pivot point and 20-day EMA. Above that, the psychological $2.00 level meets the 30-day EMA at $2.12, forming another rejection zone that trapped buyers during the last relief rally.
Bulls now guard the critical $1.55 support that has held through three tests this week despite overwhelming selling pressure. This level gains significance from multiple confluences: the 200-week EMA, 2024’s volume-weighted average price, and horizontal support from May’s accumulation zone. The USDsui stablecoin launch and expanding real-world utility through Travala provide fundamental backing for this technical floor.
Market structure reveals an oversold bounce pattern forming, with each test of $1.55 showing decreasing volume and longer wicks. This suggests sellers are exhausting near multi-month lows while early buyers begin accumulating. The next 48 hours will prove critical – either support holds and enables a relief rally toward $1.93 resistance, or breakdown below $1.55 triggers capitulation toward the $1.00 psychological level where no technical support exists.
Relief Rally to $1.93 Most Probable as Oversold Extremes Demand Reversion
Bulls require a daily close above $1.77 to reclaim the 10-day EMA and confirm the oversold bounce scenario. From there, the measured move targets $1.93 resistance where December’s failed recovery peaked. The expanding Sui ecosystem with record DEX volumes and active development ranking could provide the narrative shift needed to attract buyers at these depressed levels.
The bearish scenario activates if $1.55 support fails on increasing volume, particularly on a daily close below $1.50. Such a breakdown would trap recent bottom-fishers and likely cascade toward $1.00 where psychological support might slow the decline. Without new technical levels below current prices, the downside risk remains elevated despite oversold conditions.
Given the extreme oversold readings across multiple timeframes and third successful test of major support, the highest probability near-term path points to a relief bounce toward $1.93-$2.00 resistance. This counter-trend rally should attract sellers at higher levels, but provides swing traders a clear setup with defined risk at $1.55 support. The key for traders is recognizing this as an oversold bounce within a broader downtrend rather than a trend reversal signal.