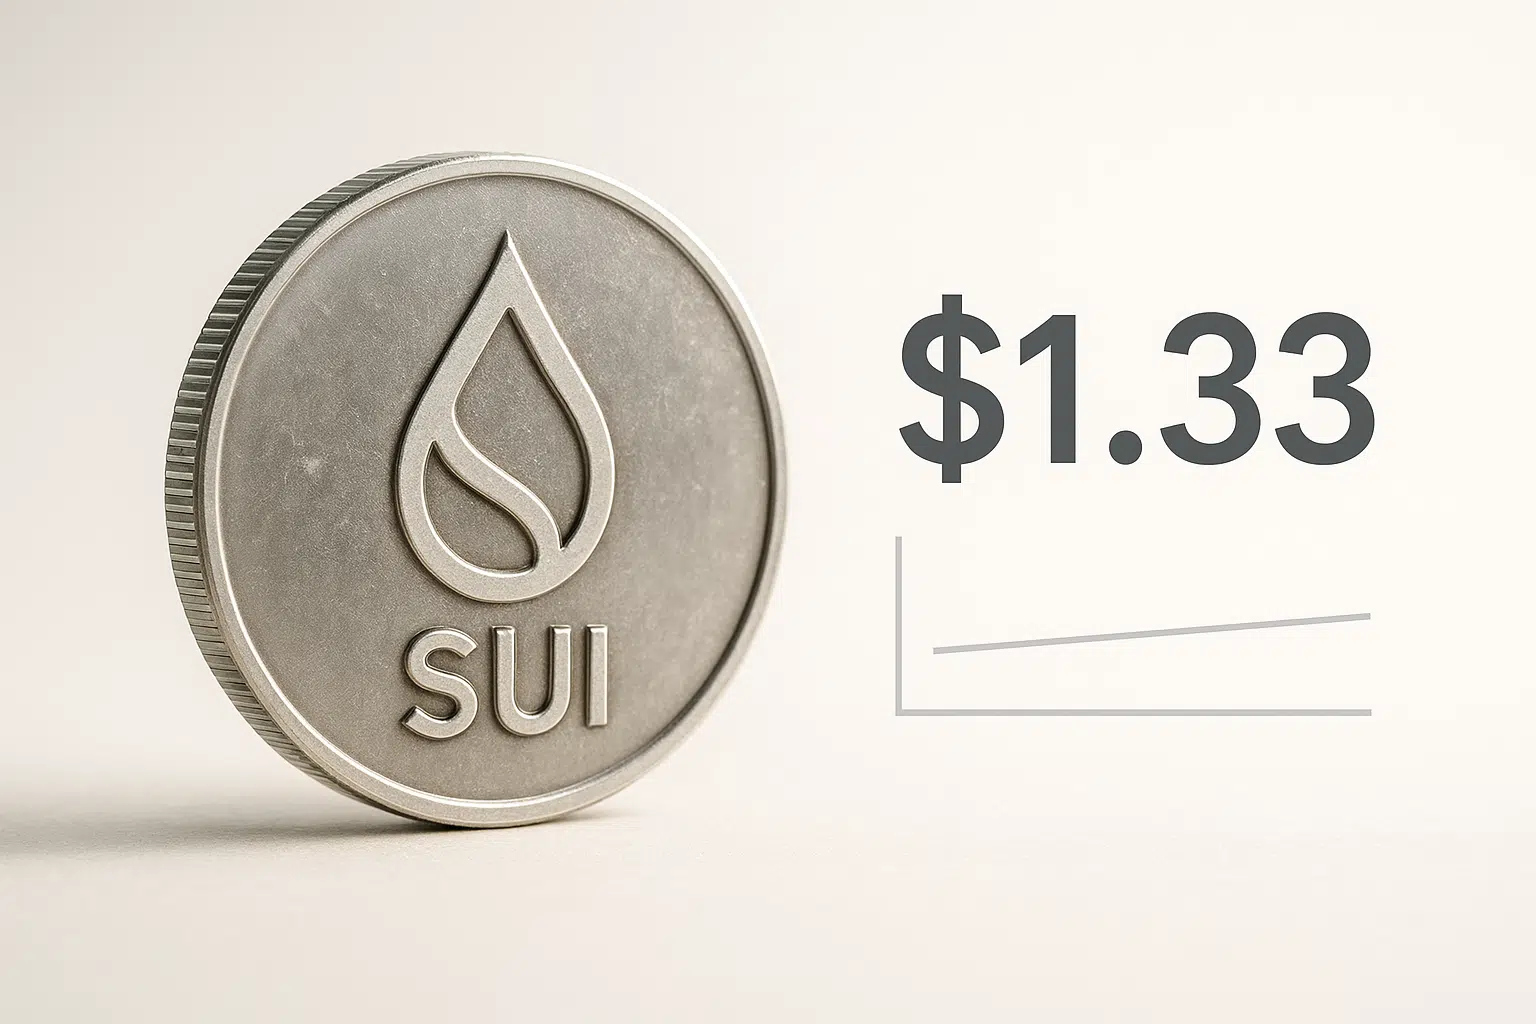
SUI Consolidates Near $1.33 as Grayscale Trust Launch Tests Market Appetite
Market Structure Shifts Lower
- SUI dropped 23.6% over the past week despite Grayscale launching institutional access
- Price hovers near $1.33 after finding support at monthly low of $1.31
- Technical indicators signal oversold bounce potential as selling pressure exhausts
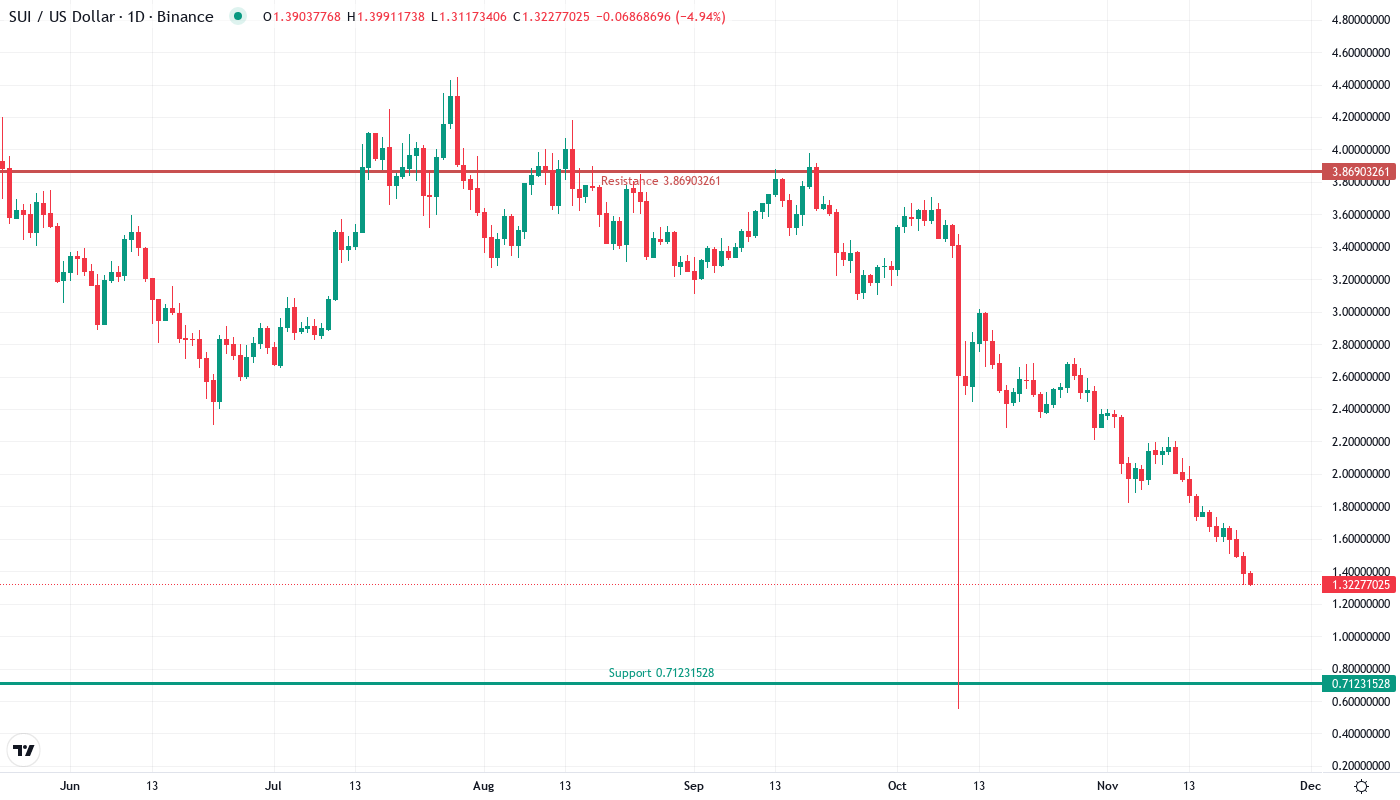
Sui’s native token has endured a devastating drop from $1.74 to $1.33 over the past seven days, shedding 23.6% even as Grayscale expanded institutional access through their new GSUI Trust listing on OTCQX markets. The token now trades just above its monthly low of $1.31, having lost 44.3% from recent peaks as broader crypto markets pulled back and initial enthusiasm around the Grayscale product failed to sustain buying pressure. The main question for traders is: does this oversold bounce represent a genuine bottom, or merely a pause before further downside?
| Metric | Value |
|---|---|
| Asset | SUI (SUI) |
| Current Price | $1.33 |
| Weekly Performance | -23.62% |
| Monthly Performance | -44.27% |
| RSI (Relative Strength Index) | 21.8 |
| ADX (Average Directional Index) | 60.7 |
| MACD (MACD Level) | -0.28 |
| CCI (Commodity Channel Index, 20-period) | -151.43 |
RSI Plunges to 34.24 – Deepest Oversold Territory Since Spring Washout
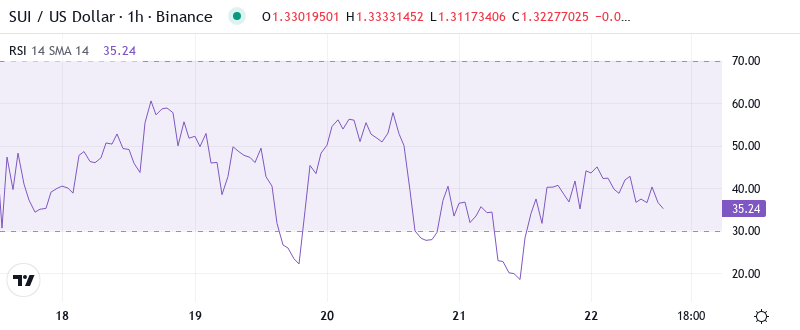
Momentum indicators flash extreme oversold conditions with RSI sitting at 34.24 on the daily timeframe, marking the first sub-35 reading since the broader market correction in early 2024. This level historically triggered relief rallies in SUI, with similar oversold extremes in March and May preceding 30-50% rebounds within two weeks.
What’s revealing is how RSI behaved during the Grayscale announcement – it barely lifted from oversold territory despite the theoretically bullish news of institutional access expanding. So for swing traders, this muted response suggests either the market had already priced in the GSUI listing, or broader risk-off sentiment is overpowering positive catalysts. The weekly RSI at 53.54 shows the longer timeframe remains far from exhausted, leaving room for further downside if daily oversold conditions don’t spark immediate buying.
ADX at 60.72 Signals Mature Downtrend Nearing Exhaustion Point
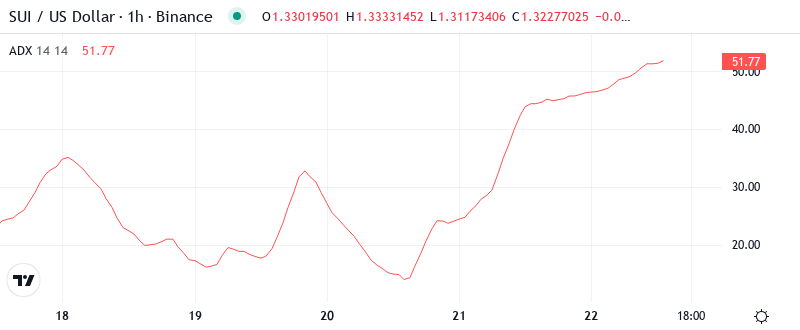
Trend strength readings paint a picture of conviction behind this selloff, with ADX climbing to an extreme 60.72 – the highest directional movement reading for SUI in over six months. At this level, the ADX indicates we’re witnessing a mature trending move that typically precedes consolidation or reversal rather than continuation.
Basically, when ADX pushes above 60, it signals that one side of the market has become extremely dominant – in this case sellers – but such extremes rarely sustain. To clarify, this doesn’t guarantee an immediate reversal, but it does suggest the easy money on the short side has likely been made. Therefore, day traders should adjust strategies from trend-following to mean reversion setups, watching for the first signs of ADX rolling over as sellers exhaust.
20-Day EMA at $1.82 Now Acts as Massive Overhead Resistance
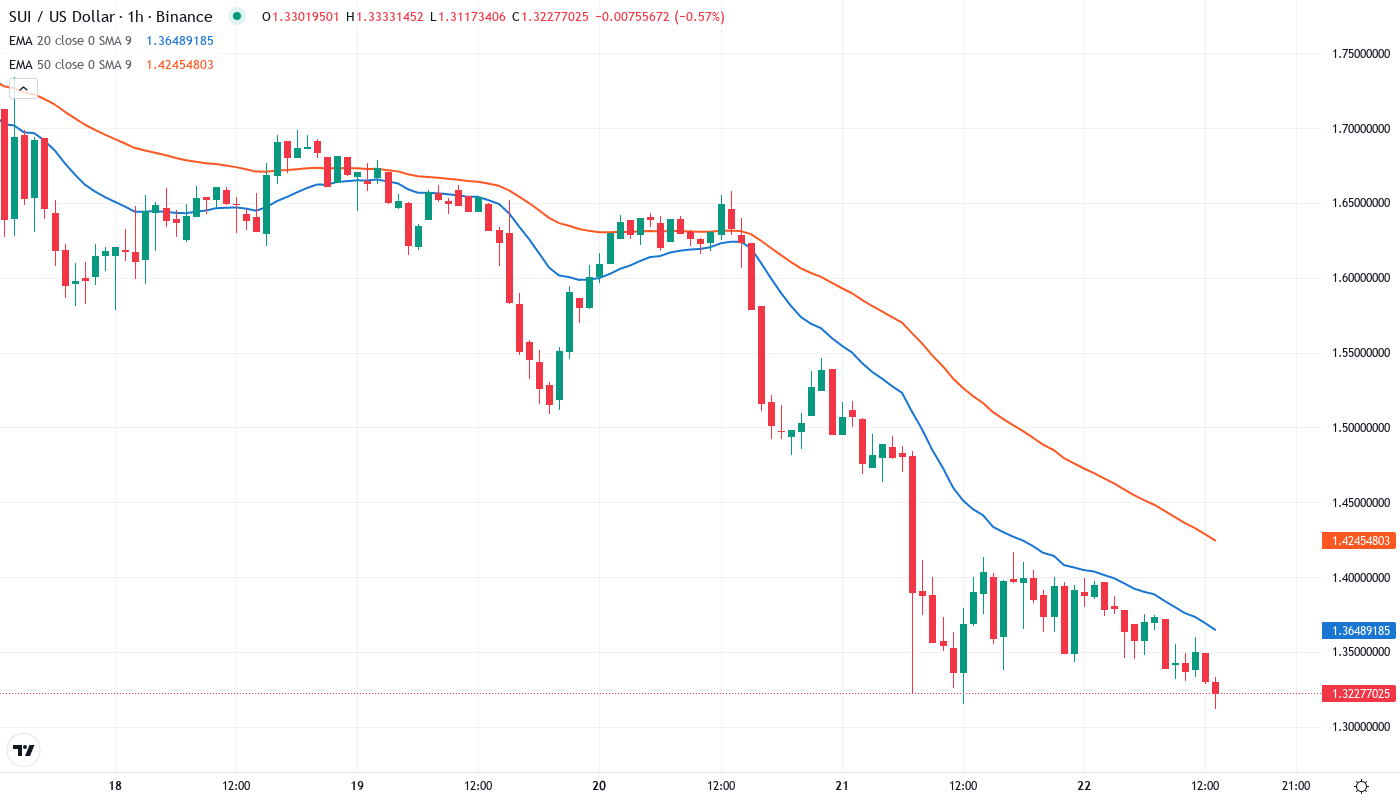
Price action through the EMA ribbons tells a stark story of deteriorating structure. SUI currently trades below every major moving average, with the nearest resistance coming from the 10-day EMA at $1.61 – still 21% above current levels. The psychological damage becomes clear when examining how the 20-day EMA at $1.82 transformed from reliable support throughout November into a ceiling that rejected three separate recovery attempts.
Most telling is the compression between current price at $1.33 and the 50-day EMA at $2.28 – a massive 71% gap that illustrates just how violently this move unfolded. The 200-day EMA sits even further away at $2.68, essentially in another stratosphere from current levels. This wide separation between price and long-term averages historically preceded either extended basing periods or sharp mean reversion rallies – with the Grayscale news potentially providing the catalyst for the latter scenario if buyers emerge with conviction.
Support at $1.31 Holds After Six Tests While Resistance Stacks to $1.72
The immediate resistance clusters between $1.61 (10-day EMA) and $1.72 where the monthly pivot R1 intersects with the psychological round number. This zone rejected recovery attempts twice this week despite the positive Grayscale headlines, suggesting sellers remain firmly in control of this range. Above that, major resistance waits at $2.21 where the monthly pivot middle aligns with recent breakdown levels.
Bulls defend a more defined support structure after six successful tests of the $1.31 monthly low – each bounce showing slightly less selling pressure than the previous. The critical support zone extends from $1.31 down to $1.24 where the monthly pivot S1 provides a secondary floor. Below that, the next major support doesn’t emerge until $0.71 at the monthly S3 level, representing another 46% downside if current support fails.
This configuration resembles a bear flag formation on the daily timeframe, with the recent consolidation between $1.31-$1.35 potentially setting up for another leg lower. However, the repeated defense of $1.31 combined with extreme oversold readings and the fundamental backdrop of expanding institutional access through GSUI creates an interesting risk-reward setup for contrarian buyers.
Bulls Need Daily Close Above $1.61 to Shift Momentum
Should price reclaim the 10-day EMA at $1.61 on a daily close with volume, it would mark the first moving average recapture since the downtrend began and likely trigger short covering toward $1.72. The Grayscale GSUI listing provides ongoing fundamental support that could fuel such a move if broader crypto sentiment stabilizes.
The bearish scenario activates if $1.31 support breaks on volume after holding six times – this would likely flush positions toward the $1.24 monthly S1 level and potentially cascade to sub-$1.00 prices at the extreme monthly S3 near $0.71. Such a breakdown would trap recent buyers who entered on the Grayscale news.
Given the extreme oversold conditions, mature downtrend readings, and significant fundamental development with institutional access expanding, the most probable near-term path sees SUI establishing a bottom between $1.31-$1.35 before attempting a relief rally toward the $1.61-$1.72 resistance zone – though any sustainable recovery requires broader crypto market stabilization.