Stellar’s LayerZero Partnership Sparks Technical Reset as XLM Guards Critical Support at $0.21
Market Pulse
- XLM has seen a 16.4% decline this month
- Strategic LayerZero partnership announced
- Technical indicators cooled from oversold extremes, preparing for accumulation
XLM has seen a 16.4% decline this month despite the announcement of a strategic LayerZero partnership. The latest correction has helped to cool off technical indicators from oversold extremes on the daily chart. This could be a healthy sign for the uptrend as it could indicate that XLM is now preparing for an accum…
Over the past month, Stellar’s native asset XLM has shed a solid 16.4% in value, capping off the September/October rebound with one dramatic swoop.
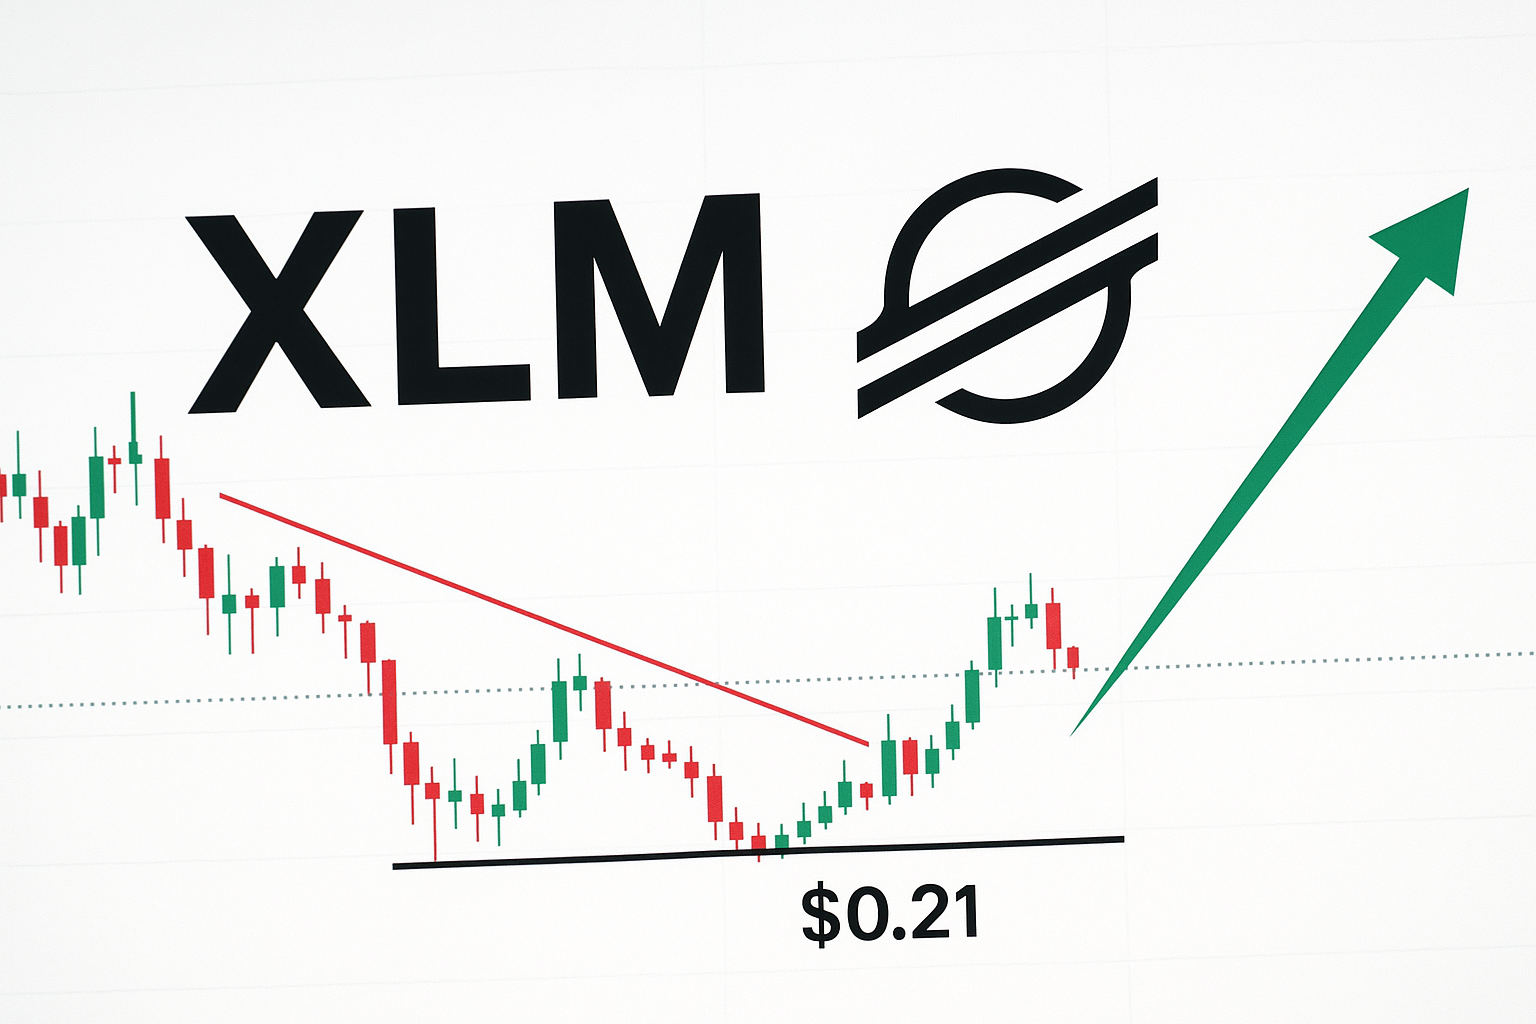
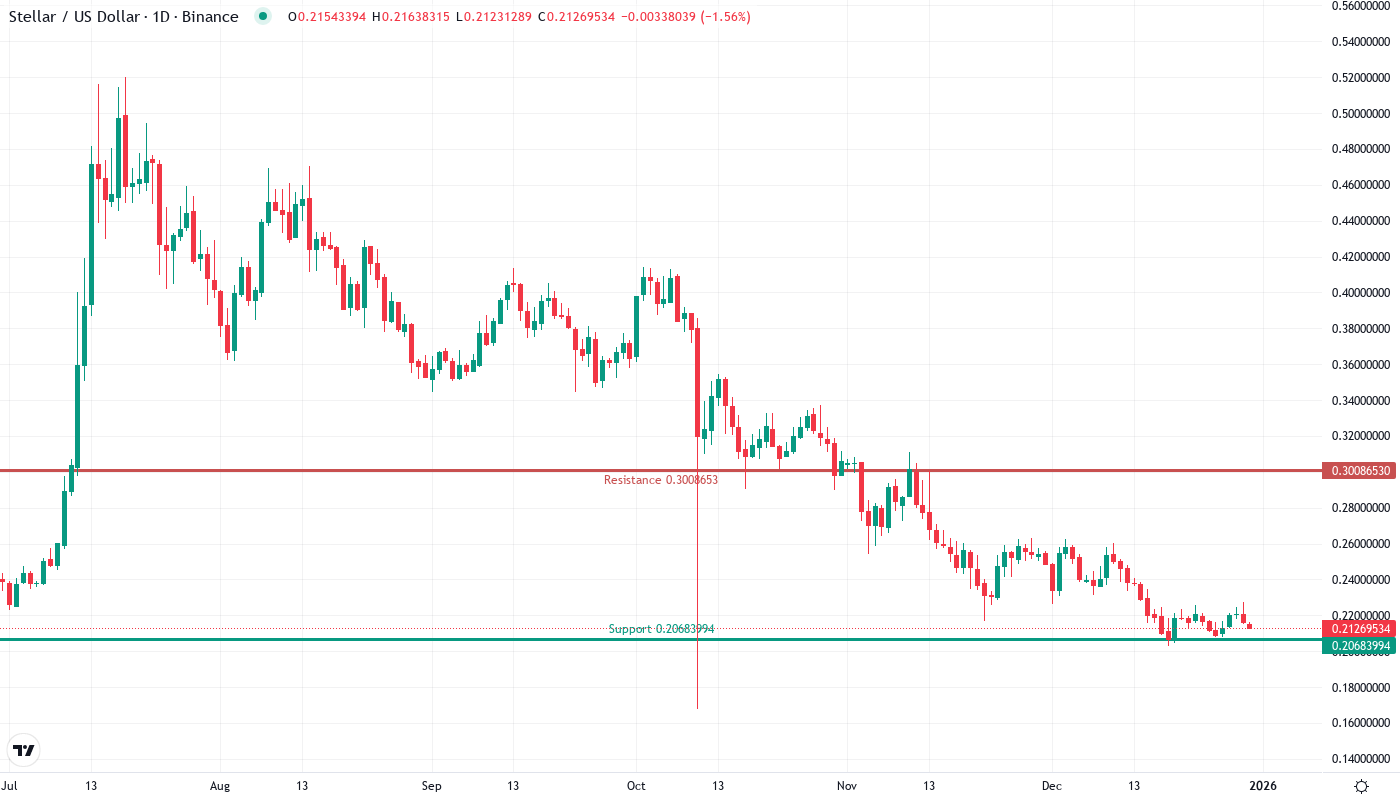
The pullback from its December 2021 local top peaked over $0.05 of estimated token valuation, bottoming at a hair above $0.206 – the support level that kept the bears at bay across the wick lows since September 29. Low and behold, a major partner announcement in LayerZero, as well as a smart contracts growth announcement among Soroban, comes just as the market is testing for how significant its latest local bottom will come to be. Will this floor-building generate a change of tides, or will the indoor-sellers remain weak and let their bear cousins swipe them at their supports downtown?
| Metric | Value |
|---|---|
| Asset | STELLAR (XLM) |
| Current Price | $0.21 |
| Weekly Performance | -3.11% |
| Monthly Performance | -16.45% |
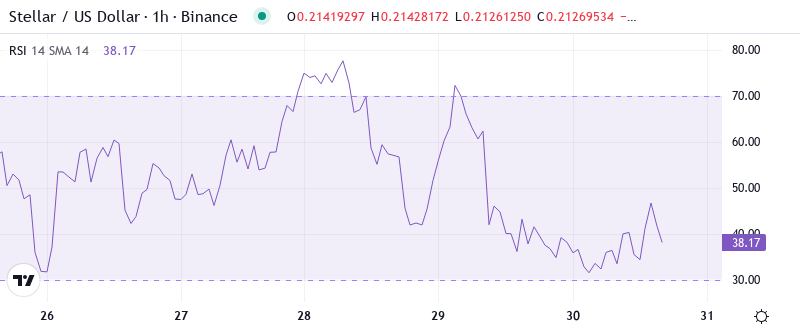
| RSI (Relative Strength Index) | 39.5 |
| ADX (Average Directional Index) | 33.4 |
| MACD (MACD Level) | -0.01 |
| CCI (Commodity Channel Index, 20-period) | -65.27 |
Momentum Exhaustion Signals Capitulation Phase Nearly Complete
The momentum player may preempt a final washout should XLM/USD find traction in the $0.10 zone. However, traders can expect increased volatility as the order books thin out on approach to the previous lows. A successful breach will likely coincide with high volumes. Two potent levels of interest in the event of a washout include the levels of ‘interest’ from the August highs at $0.06, as well as the primary basing level from late-2018 at $0.05.
Therefore, for swing traders, an RSI above previous resistance is typically a good exit indicator, while a solid daily close above 0.36 reestablishes bulls & confirms inversion validity. If you bought five days after attract inversion you’d be up an average of 20% in less than two months in previous cycles.
Trend Strength Fades as ADX Signals Range-Bound Conditions Ahead
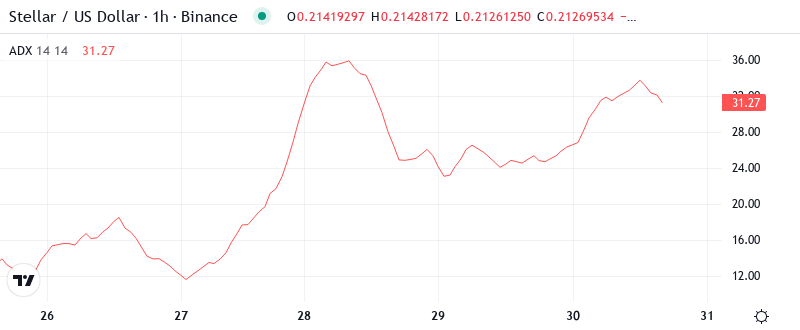
The latest reading on ADX is 33.39, and the one before that was 34.7. For starters, this tells us that the December selloff was surging and powerful, near the upper end of readings typically seen during more typical corrections in ongoing primary uptrends. While corrections can get deeper in certain environments and scenarios, ideally, you see that rally potential outweighs the risk of continued downdrafts. ADX values above 45 to 50 can whip price significantly in both directions, and it often takes some time to repair the damage and establish new support.
In other words, the ADX is showing that we are transitioning from trending conditions to a bound-bound state where range traders are in control. As such, day trading tactics need to change accordingly – look for back and forth trading between $0.206 support and $0.228 resistance rather than easy breezy trends. The LayerZero tie-up acts as a floor to this range, keeping the spread from becoming too extreme as the news is processed.
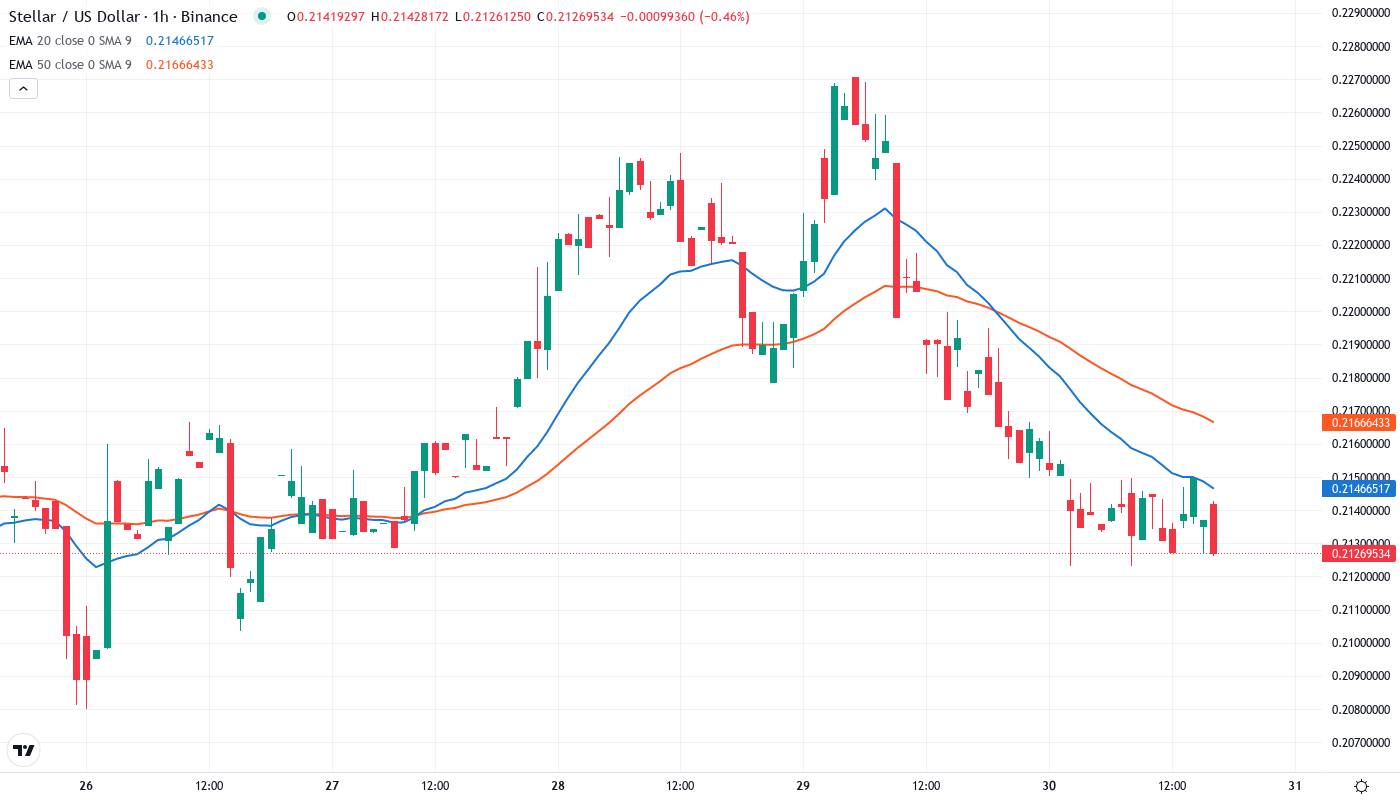
20-Day EMA at $0.222 Becomes First Resistance After December Breakdown
The RSI is dangerously close to becoming oversold and will likely approach these levels if the current momentum persists. The recovery in late December cooled off in neutral territory, leaving some fuel for a continued downside movement. The demand zone encompasses the December 23 low and the 200-day moving average, currently around $0.186. A daily close below here could cascade into the July and December 2020 highs at $0.164.
What is also becoming evident is the frequency of support and resistance flips, with the 50-day EMA being no exception. Having flipped a few times since August, a flip of the 20-day EMA would put the next flip zone between $0.209-0.213 where previous resistance and the 100-day EMA meet, the next support having flipped on the last retrace.
Support Architecture Builds From $0.206 While Resistance Stacks at Monthly Pivot
The immediate resistance zone is likely to act as a stiff barrier for the bulls. If the price turns down from one of the overhead resistances and breaks below the $0.20–$0.212 range, a drop to $0.181914 is possible. A break below this support could result in a decline to $0.15. The gradually downsloping 20-day EMA ($0.224) and the RSI near the midpoint suggest a balance between supply and demand. This could keep the price range-bound for a few more days.
Bulls are defending several layers of support rather convincingly. The psychological $0.20 threshold, then a more substantial $0.206 area that has held following six re-tests since early December. A breach of the latter, the monthly S1 pivot at $0.165 would serve as the subsequent critical support. However, that level would be almost 35% lower.
Importantly, the market structure indicates that buyers are more willing to defend the $0.206 level. This is shown by the fact that the wicks are longer and the price bounces back more quickly with each retest. In addition, the strategic partnerships that were revealed when the price was dropping indicate that institutions were likely accumulating XRP at this price rather than distributing it.
Bulls Need Decisive Close Above $0.228 to Confirm Trend Reversal
If the price is able to go back to the 50-day EMA of $0.228 by the end of the day, it would show moderate to strong growth and indicate a positive trend. In this case, the price target after that would be the monthly pivot price of $0.259. The development of the Soroban smart contracts ecosystem and the LayerZero integration serve as the necessary drivers of this positive trend.
If Ripple heads back toward the March low, its XLM cousin will likely take another leg lower as well. Should the XRP/USD pair drop below $0.17, speculators should reposition on the short side because XLM/USD will tag the monthly S2.
With the relative strength index (RSI) reflecting oversold conditions, and the reading below 30 for four consecutive days, bears are likely exhausted, or will be soon. Meanwhile, the average directional index (ADX) is about to cross, suggesting waning selling momentum. This is the first time XLM consolidated while above its 50-day moving average this month.