Stellar (XLM) Tests Critical Support as Bulls Mount Defense at $0.23
Market Structure Shifts Lower
- XLM dropped by 10.7% this week, eliminating all of the gains the altcoin made in November.
- Bulls managed to defend the key support area at $0.23 for the third time.
- Some technical buy signals appeared as the price entered oversold conditions.
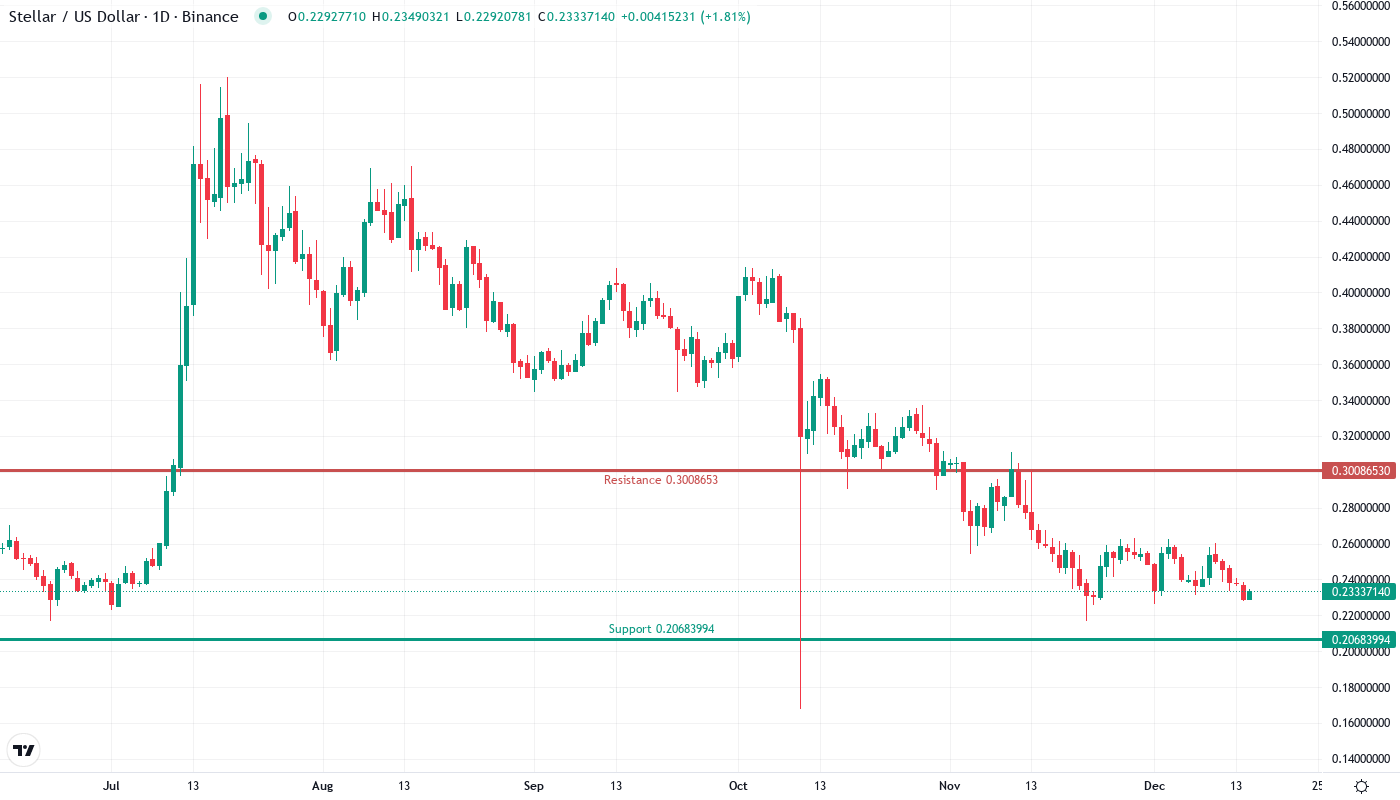
Stellar kept dropping this week and lost 10.7% to close at $0.2319, which is a whopping 38.9% decrease from the local top over three months. The faster decline happened despite a series of technical trading hints that shrieked buy in all shapes and forms. Tellingly, TD Sequential presented a signal on the daily chart, the next-to-last time it had predicted an uptrend it catalyzed a 70% rise. Hence the question for speculators: will the bulls manage to defend $0.23, or will the support that’s been touched three times finally give in?
| Metric | Value |
|---|---|
| Asset | STELLAR (XLM) |
| Current Price | $0.23 |
| Weekly Performance | -1.98% |
| Monthly Performance | -10.71% |
| RSI (Relative Strength Index) | 39.6 |
| ADX (Average Directional Index) | 28.2 |
| MACD (MACD Level) | -0.01 |
| CCI (Commodity Channel Index, 20-period) | -128.69 |
RSI at 39.6 Signals First Oversold Reading Since October Bottom
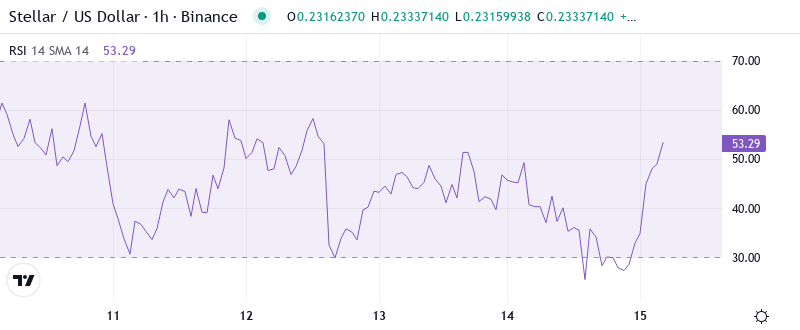
When the previous oversold conditions registered in late Sept/early Oct, XLM fell from $0.30 to $0.20 before posting five consecutive winning days. It then posted five more negative days to new lows before climbing higher.
What is noteworthy is the behavior of RSI on the way down – it slipped under the 50 level as early as two weeks ago, and did not manage to get back above it, despite a couple of relief bounces. This means that, for swing traders, the current oversold bounce may present an opportunity for a trade, while the failure to maintain levels above 50 does send a caution that sellers are actually dominating the larger trend.
ADX Climbs to 28.2 – Downtrend Gains Conviction
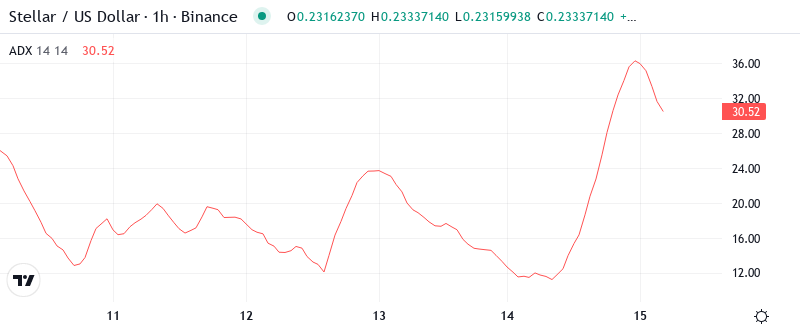
The ADX reading at 28.2 verifies that we have transitioned from December’s choppy consolidation phase to an actual trending market – regrettably for the bulls, that trend is to the downside. The surge from sub-20 to almost 30 in two weeks’ time illustrates that the sellers are not simply liquidating longs, they are building a broad, persistent downtrend.
People who follow trends should pay attention to the ADX setup, which usually means the trend will continue rather than reverse, especially when it is accompanied by the bearish price pattern. In short, as long as ADX doesn’t start falling from these high values, the easiest direction is down, even though current levels are indicating the price is low and you should buy.
20-Day EMA at $0.245 Becomes Resistance After December Breakdown
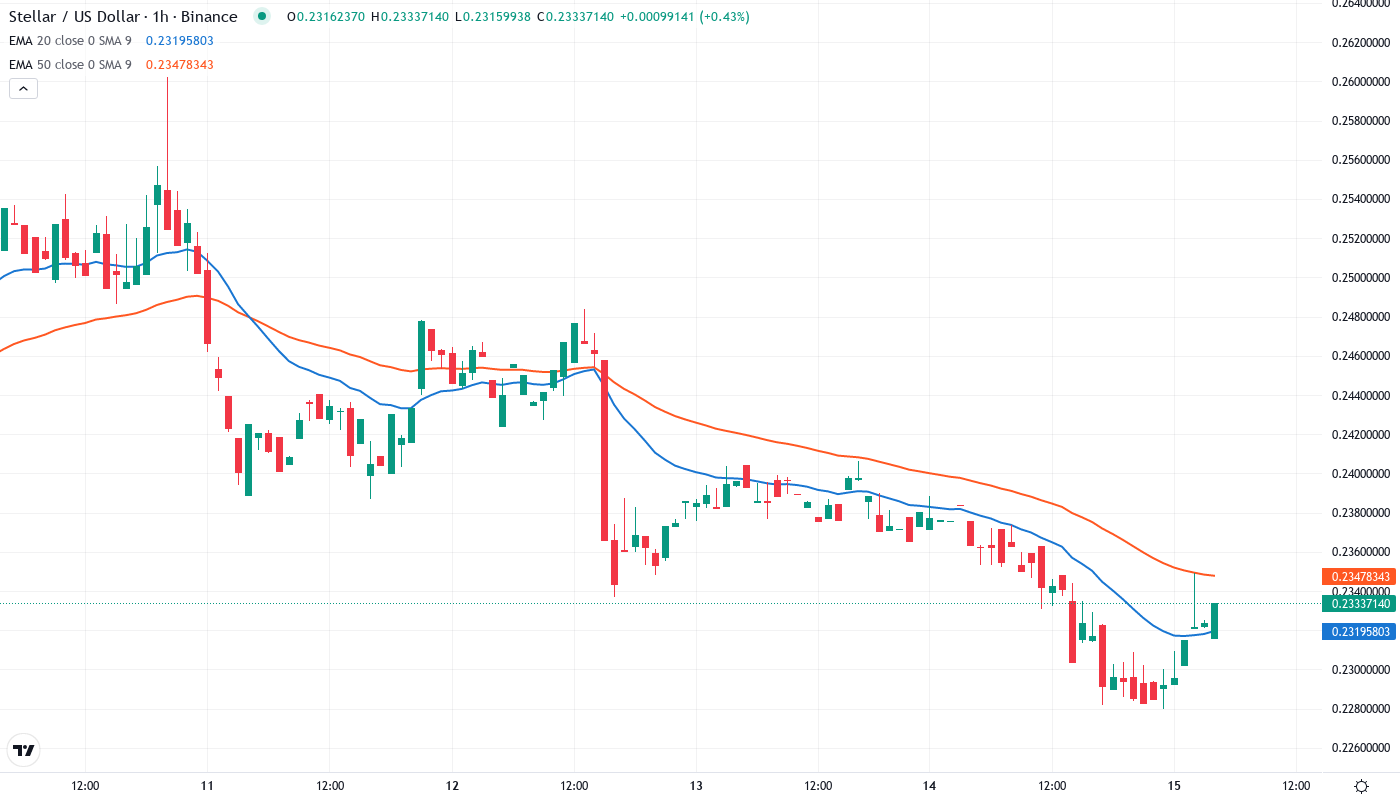
The 10-day EMA likewise crossed below the 50-day EMA this week, signaling further short-term weakness while the descending 50-day EMA supports a new bear trend. Further, the 10-4 facilitation oscillator is back in the red after a bullish reclaimed ‘0’ failed to fuel a sustainable recovery. The Money Flow Index has meandered between 30 and 50 as the XLM price continues to trend lower.
What’s even more worrying for optimists is that the 200-day EMA is still as high as $0.213, so in order to test the long-term support, the price would have to decrease by extra 8% from the current level. The fact that the 10-day and 20-day EMAs are converging tells us that any up-moves will be stopped in the $0.240-0.245 area – a very small range that acted as a stiff resistance over the past week.
Bulls Guard $0.23 Support After Three Tests While Resistance Stacks Above
The initial support at $0.23 has held bulls back from the red line to defend, and in the last ten days of testing, it hasn’t been broken. Each of the tests has used a bit more space, while the TD Sequential and other indicators have begun to send purchase signals at certain levels.
Sellers have created a strong resistance barrier above the prevailing price at $0.245 (20-day EMA) to $0.260 (November’s support). Additionally, the monthly pivot point stands at $0.258. Hence, a strong resistance cluster is likely between $0.245 and $0.258. This level is likely to prevent a relief rally with a 12% gain.
Important for the market structure, XLM is currently caught in compression between strong support at $0.23 and equally strong resistance at $0.245 – a coiled spring formation that tends to violently resolve, one way or the other. The fact multiple buy signals emerged right at support, indicates that bulls may be ready to make their final stance, though doing so will require a large volume to overtake overhead supply.
Technical Buy Signals Meet Oversold Conditions at Make-or-Break Support
To stop the bleeding, bulls need to print a daily close above $0.245. Doing so would release the immediate downward pressure and let bulls take a breather, potentially allowing XRP to push up towards $0.26. There is a favorable technical setup for a relief rally as TD Sequential buy signals coincide with oversold RSI. However, the broader cryptocurrency market must also provide some stability.
If the $0.23 support doesn’t hold and triggers the stop-loss, it will quickly turn from a major bullish argument to a bearish trade. Hence the stop-loss should be placed at $0.229. A break below this level would mean that most likely the bearish scenario will play out, yet repositioning to sell XRP/USD is not recommended. It is a hold or a long.
Based on the technical buy signals that have materialized at levels not seen since March 2017, it seems as though the most likely short-term direction is a relief rebound to test $0.240-0.245 resistance, barring a fundamental catalyst or overall market turnaround.