Solana Tests Critical Support as XRP Bridge Launch Fuels Mixed Signals
Market Structure Shifts Lower
- XRP-Solana bridge functionality launched this week.
- SOL price dropped 8.1% despite the launch.
- Bulls are defending the $120 support level.
Despite the fact that XRP-Solana bridge functionality was launched this week, SOL price dropped 8.1%. Technical indicators are showing an oversold condition since the 45% crash in December from the peak at $146. However, bulls are trying to defend the $120 level. Many analysts indicate it is key to support this level in order to pursue the $500 level.
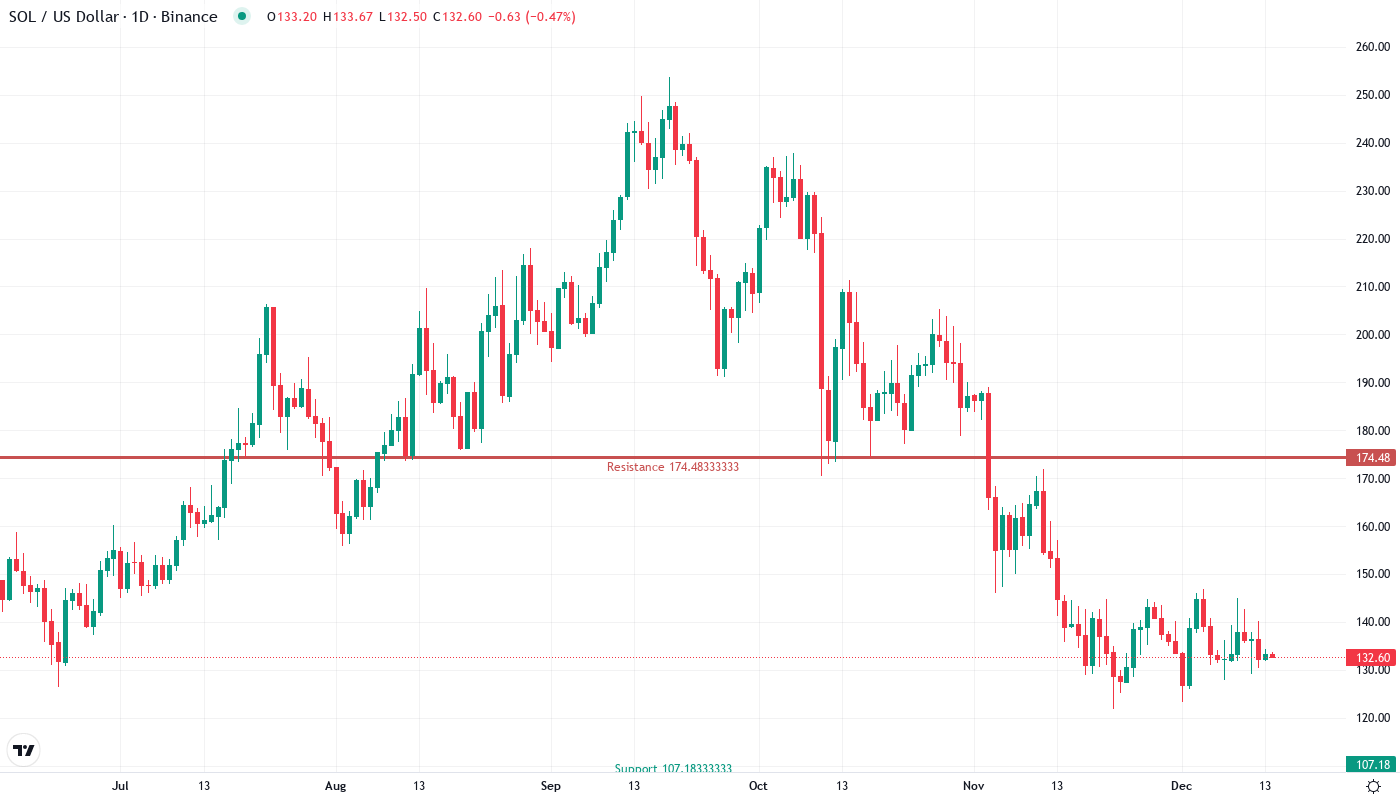
Solana’s price development divided by two different stories this week. While the news about the XRP-Solana bridge launching was pretty bullish, with traders now able to access cross-chain DeFi between the XRP and Solana ecosystems, the price of SOL wasn’t reflecting the positive sentiment. The token dropped 8.1% to $132.65 while news of the bridge crossed the wires. More importantly, during the same period, SOL was retesting the psychologically critical $120 support and forming a potential double bottom. The interplay between bullish news catalysts and these headlines might end up determining whether technical support breaks or the 2019 yearly high of $26.22 remains secured. The more fundamental improvements arrived from the Size.US (XRP) bridge, the more substantial possible recovery in price action SOL could have, though almost no one believes it would bring the token to the previous ATH above the startup target of $500.
| Metric | Value |
|---|---|
| Asset | SOLANA (SOL) |
| Current Price | $132.65 |
| Weekly Performance | 0.33% |
| Monthly Performance | -8.13% |
| RSI (Relative Strength Index) | 42.8 |
| ADX (Average Directional Index) | 26.2 |
| MACD (MACD Level) | -3.96 |
| CCI (Commodity Channel Index, 20-period) | -71.78 |
RSI Hits 42.75 – First Oversold Signal Since November’s Base
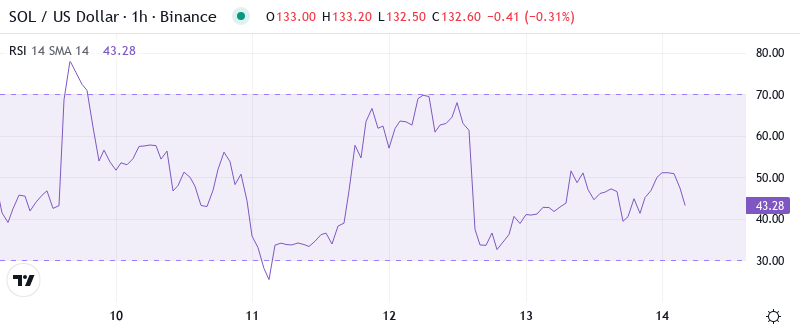
The Relative Strength Index is at 42.75 on the daily chart, the first time it has dropped below the ‘neutral’ 50 line since the ‘dip’ lows of September provided the base for November’s surge to $150. Today’s reading is indicative of mild oversold conditions and is not yet close to the extreme capitulation zones sub-30 which usually signal major lows.
By looking at past patterns, comparable RSI settings around the low-40s in September and early November each ended up with strong recoveries after the downtrend. Therefore, for swing traders, this reasonably oversold reading along with the XRP cross effect indicates that we are in a high-chance recuperation zone, but confidence continues to be low due to the technical breakdown in the broader markets.
ADX at 26.22 Signals Trending Conditions Return After Consolidation
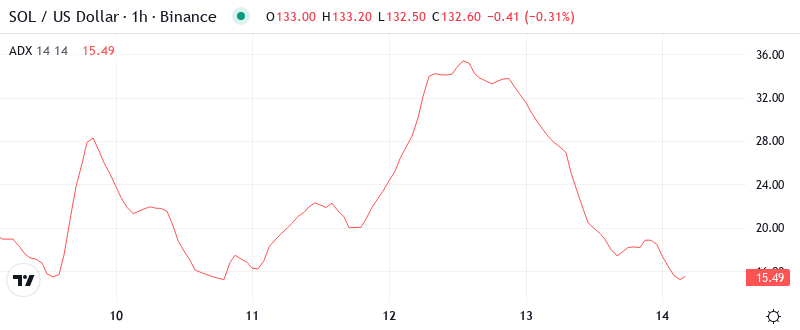
The ADX reading at 26.22 suggests that the market has left December’s back-and-forth consolidation behind and entered a more directional trending environment. In simple terms, when the ADX rises above 25 as it has here, it indicates that one side, the bulls or the bears, is starting to wrestle control. And based on what prices have been doing lately, it’s the bears who are winning that fight.
What bulls find worrisome is the pace at which ADX moved from the low teens only a fortnight back. The transition from a choppy phase to a trending one usually sustains for a few more weeks. As such, day traders are advised to make the necessary adjustments in their trading system to favor following trades rather than mean reversion trades.
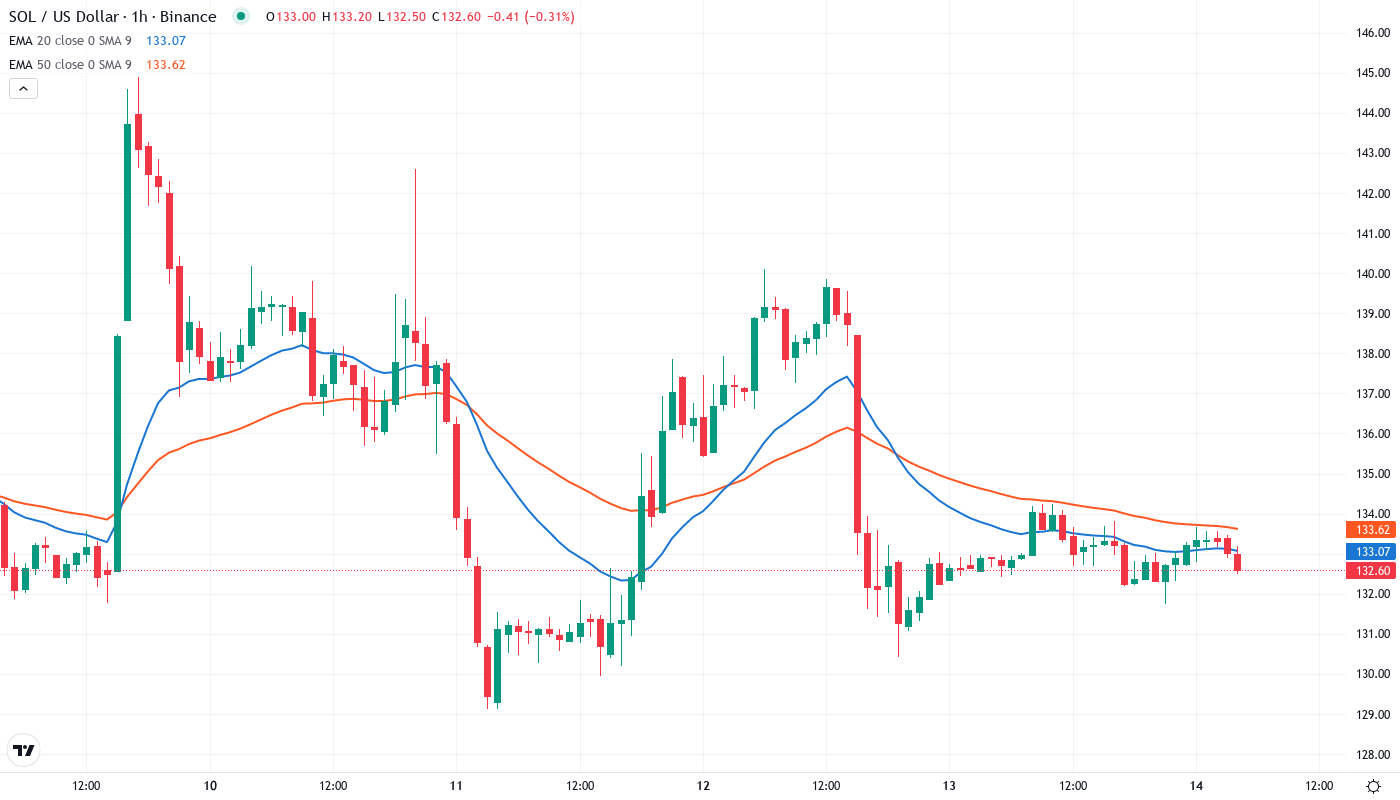
20-Day EMA at $136.48 Becomes First Resistance After Support Failure
Looking ahead, SOL/USD must remain above the 100-day simple moving average (SMA) at $126.52 to avoid another test of the 120-day SMA at $116.63. A breach of that support level activates stops on a path to the November swing low of $102.50.
What’s more, the 4-hour chart shows price below the 200 EMA and needing to regain oscillators while the 50 EMA prepares to cross them both bearish. Therefore, there is some hope on the volume profile but price must consolidate above $116.02 with sufficient demand pushing it through the 50 EMA to invalidate the selling-so-far scenario. Slotting in supports should $116.02 fail to hold are $109.10 and then $101.67.
Resistance Stacks Between $140-$150 While $120 Anchors Support
There are resistance clusters right above, with the initial one lying at the 30-day EMA at roughly $140.38. The $150 area is psychologically significant as well as where December’s breakdown gathered steam. The 50-day EMA is hanging around at $149.69, which reinforces the resistance in that area. It would take a lot of buying pressure to push through it, probably more than just the DeFi integration announcement.
On the support side, everyone is looking at the $120 level, which analysts have pointed out as the “line in the sand” to maintain a bullish market structure. SOL bounced directly from $121.77 this week, indicating that institutional buyers are still defending the zone. Below that, the monthly S1 pivot at $107.18 is the next notable support, but if $120 is lost, stop-loss cascades could be triggered toward the psychological $100 level.
The market structure looks like compression between weakening resistance and tested support. This coiling usually pops with a violent move either up or down with the XRP bridge and Phantoms new prediction market features acting as possible catalysts once the technical levels give way.
Bulls Need Decisive Close Above $136.48 to Shift Momentum
In order for the bullish scenario to play out, the bulls would also have to overcome this resistance band. Until that happens, this market should be viewed as a “sell the rally” opportunity as the trend is decidedly down in the short-term, intermediate-term, and longer-term.
If SOL dips, $107 support may test after $120. The price should not dismantle the $107 level; it will then drop down to $100. Investors expect this level to hold the price higher. This may be followed by potential losses likely crashing to $80 for an attractive re-entry.
With the RSI indicator showing a severely oversold condition and the average directional movement index (ADX) trending in the same direction for SOL, it seems likely that in the short-term, we bounce back up to test $140 as a resistance parameter before the overall trend takes over again. The greater trend has been down for nearly three months now, since we peaked out just below $220 and heavy selling pressure pushed us back through the 22-weekly EMA.