Solana Tests $126 Support as Institutional ETF Flows Build Defensive Floor
Market Structure Shifts Higher
- Institutional ETF assets have surpassed $900 million, offering a new cushion for support despite some recent price decline.
- The most recent test of the six-month low at $126 has also held, despite the ongoing test.
- With today marking the expiration of the December 6th AM settlement (Cure), the futures listings have now further expanded access to the markets.
As we have mentioned frequently in recent posts, we believe this Market Structure facilitation has been a compression process, rather than a consolidation, and is beginning to evidence an exit to the upside. The ADX, which measures trend strength, is currently trading above .25 at 25.4, which also is above the Range Roll Level. The ADX suggests the positive change in the last month of trading has also been under the shift.
Solana is currently trading at $126.31, having lost 7.8% in the past month, but this correction appears to be bottoming as institutional infrastructure growth explodes beyond the network. The launch of $900 million in ETF assets combined with new future listings makes for a defensive floor not seen in previous corrections. While the token teases the monthly low of $116.94 several times, it currently holds – asking traders if institutional demand could lift up everyone’s technical weakness or if SOL demands lower before taking a stand?
| Metric | Value |
|---|---|
| Asset | SOLANA (SOL) |
| Current Price | $126.31 |
| Weekly Performance | -4.53% |
| Monthly Performance | -7.79% |
| RSI (Relative Strength Index) | 41.5 |
| ADX (Average Directional Index) | 25.4 |
| MACD (MACD Level) | -5.06 |
| CCI (Commodity Channel Index, 20-period) | -92.92 |
Momentum Exhaustion Signals Capitulation Phase Complete
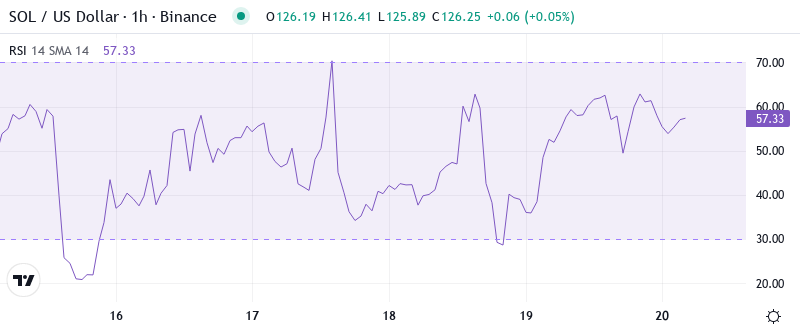
The Relative Strength Index (RSI) is at 41.3 on the daily timeframe, showing the first oversold condition since the August washout that led to a 40% rally. The fact the RSI went about its usual business during the descent, ranged from extreme overbought conditions north of 70 in early December to its current level without any of the post having real-time rebound, remains the warning sign that a fully encompassed momentum reset is a gradual down.
Comparable RSI set-ups in the past saw sharp spikes in the share price, especially when firm news triggered institutional buying. For swing traders, this oversold signal and increased ETF buying indicates that the wash-out phase is close to ending. One more decline towards RSI 35-38 would present an even better buying opportunity.
ADX at 25.4 Signals Shift From Chop to Trending Conditions

When considering trend strength, the reading of the ADX at 25.4 is a mighty inflection point after much of December it is below 20. The indicator exceeded 25, when the price just started to stabilize around $126, which can mean transition of the market from the action to the chopped-square without a clear direction which has upset both bulls and bears to the stadium with a clearer trend.
Let me make it simple. When ADX spikes higher from extreme low levels, as we are observing now, in the past it has tended to signal an approaching large directional movement of between 15 and 20% to the upside or downside. So day trading goes from being a game of pinball, with mean reversion all the rage, to a straightforward momentum chase. The next big move is already in the post and is simply gathering steam. The raft of new future issuances provides the required deep pools of liquidity to support that new direction.
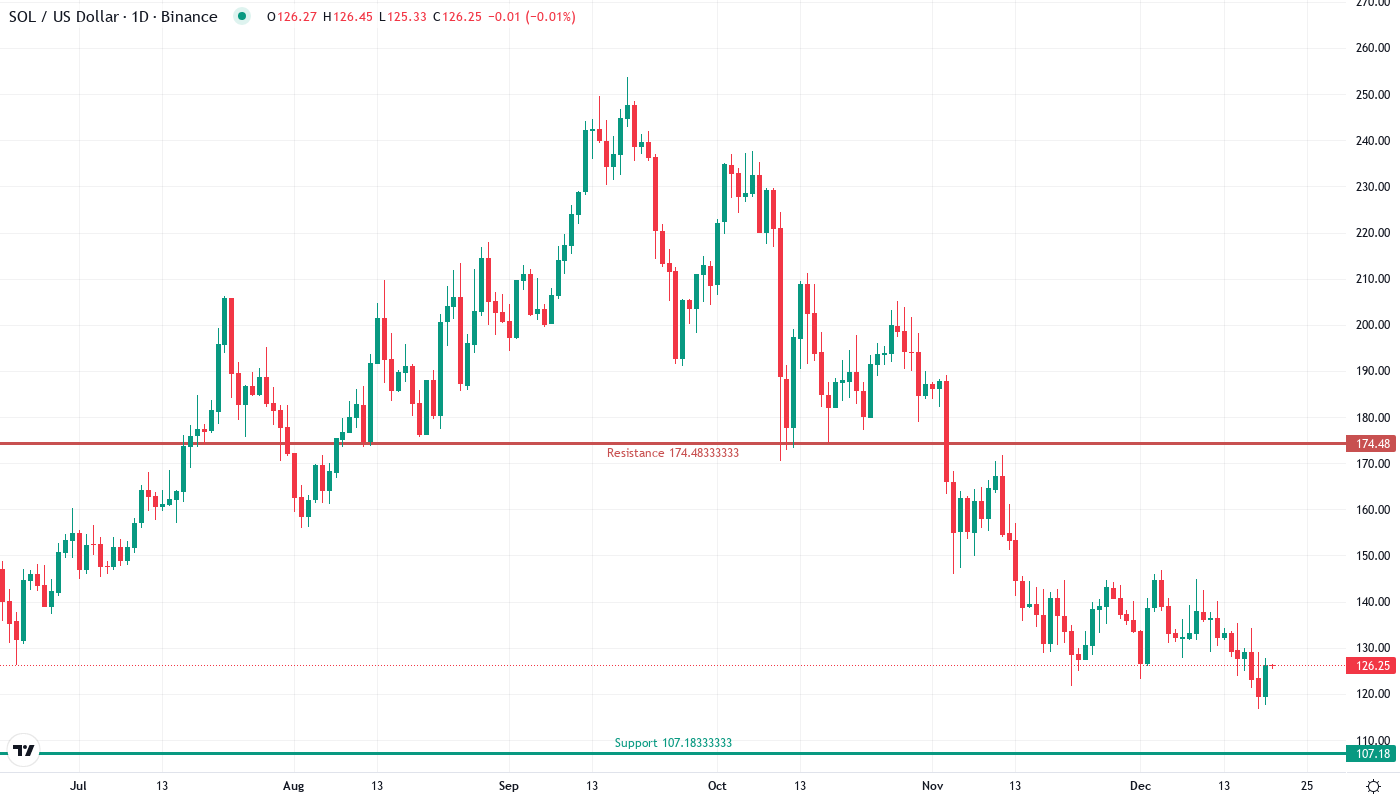
$126 Support Transforms From Resistance After Six Rejection Attempts
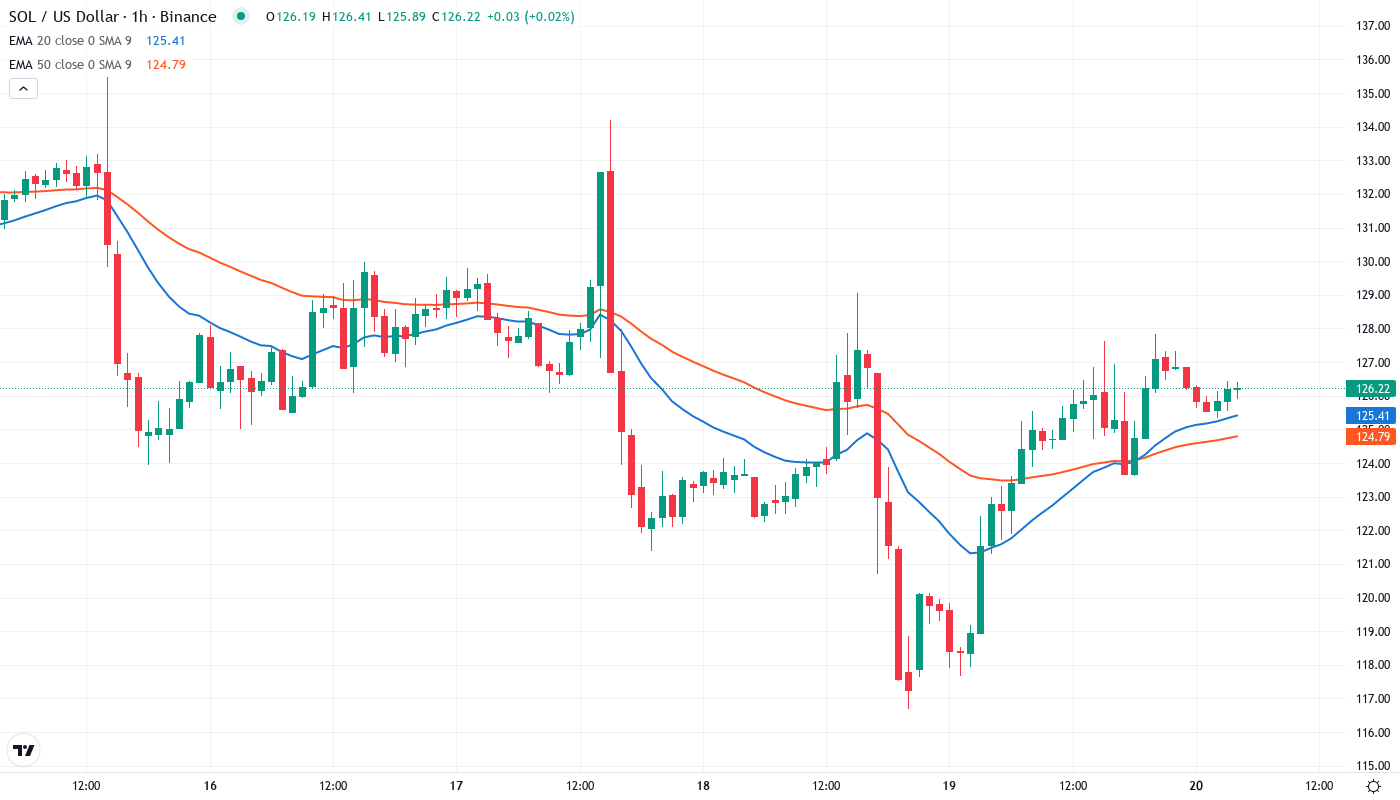
The price action narrative is evident through the EMA architecture. Right now, SOL is trading slightly below the 10-day EMA at 127.77 and the 20-day EMA at 131.25, but more importantly, it is still trading above the 50-day EMA at 135.27. This is similar to a spring being compressed as the monthly low serves as the floor and the overhead resistance as the compressing force.
The most important aspect is how the level of $126 shifted from being resistant in early December to supportive throughout the past week. The 100-day EMA at $140.05 and 200-day at $115.36 form the broader range, but it’s the compacting of price action around $126 that forms the immediate battleground. Every trial of this level experienced more volume with institutional buyers likely involving themselves with ETF re-balancing flows.
Resistance Stacks Between $131-$140 as December Highs Meet Moving Averages
Sellers have established several resistance levels above the current price, ranging from $131.25 (20-day EMA) to $140.05 (100-day EMA). With a target of $146.88, which is the monthly high, bulls will also have to surpass the 50-day EMA and resistance at $135.
Bulls are defending a more sophisticated support structure underneath, with $126 already going through six tests since late December. The critical floor is at $116.94. Lose that and the trapdoor opens to $107, where the monthly S1 pivot is located. Importantly, the expanding institutional footprint via ETFs poses natural demand on any approach to $120, a factor that hasn’t been in play during past pullbacks.
The market structure shows an asymmetric risk-reward set up. On the one hand, there is strong resistance above, but with bears defending $126 multiple times paired with oversold momentum indicators, it seems like the downside potential is limited. This level has also flipped from resistance to support just like in November before SOL rallied to annual tops.
Bulls Need Decisive Close Above $131 to Confirm Trend Reversal
If the price can go back to the 20-day EMA of $131.25 and truly have buyers support this change, then the bull’s view will be immediately confirmed. At this point, the short sellers who got in during December will be trapped and a rally towards the $140 level can be expected. Any recovery can be maintained by the institutional framework that is still growing.
If $126 gives way on tick higher, the bearish scenario is obviously in play, especially with ADX readings lifting above 30 which indicates real trend strength to the downside and likely position flush to the 200-day EMA at $115.36. A 9% drop resets the market completely and the recent news of Tron surpassing Solana in DeFi yield could certainly incentivize some capital rotation if that happens.
Considering the current momentum exhaustion, the flow of institutional support, and how $126 was successfully defended after several tests, it is most likely that SOL will stabilize between $126 and $135 next week. Following this, it will rise again. It’s a good risk-return ratio for potential buyers since the technicals are oversold and the fundamental infrastructure is growing.