Solana Darts Past $155 as ETF Inflows Build Momentum

Market Structure Shifts Higher
- SOL aggressively surpassed the $155 resistance level, being 10 days in a row of ETF inflows, which signal institutional accumulation.
- New SoFi crypto trading brought millions of new customers and ADX is at 34.67 confirming serious trend strength is being built.
- Since the price moves all above the significant EMAs, it is an indicator that the correction phase is over and buyers are controlling again.
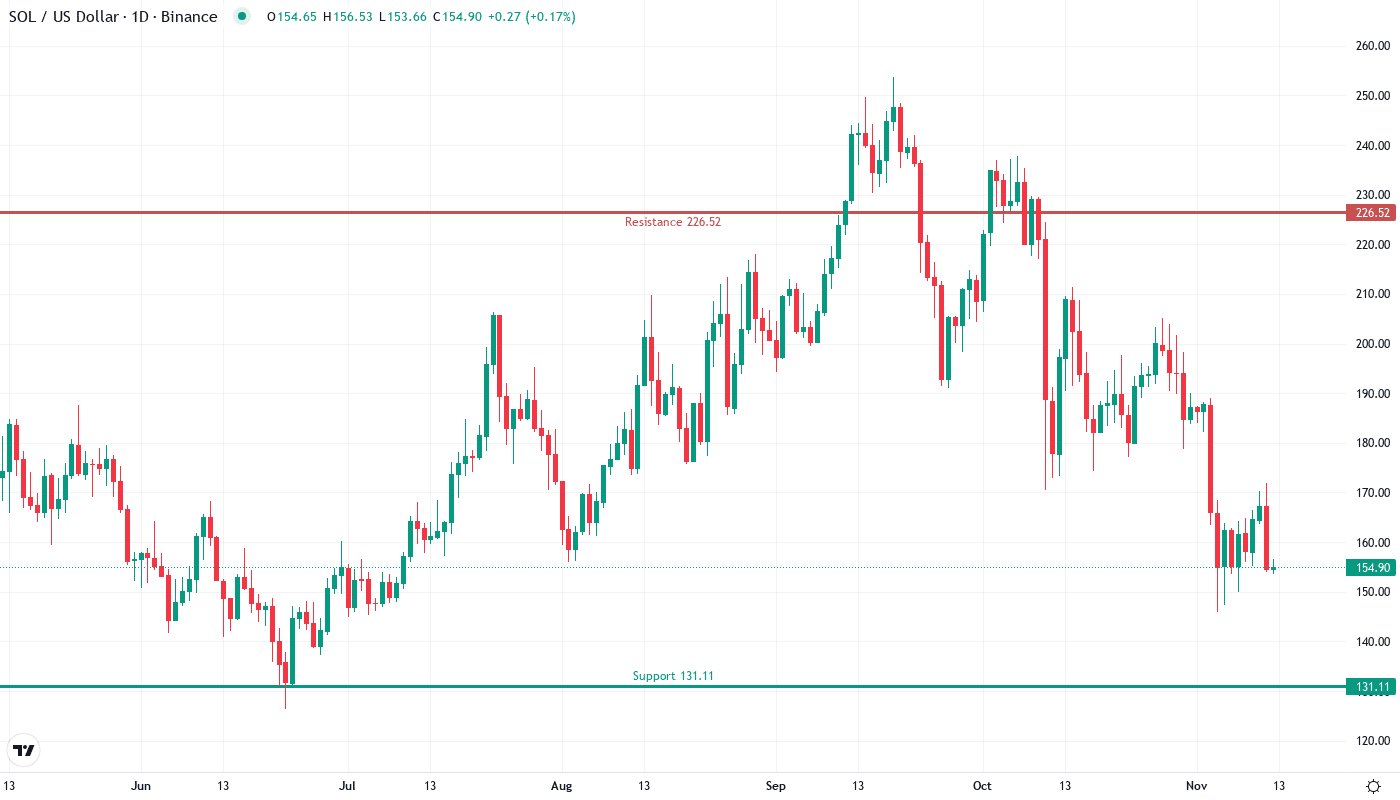
Solana skyrocketed 22.9% from the monthly low of $145.96, jumping over the psychologically crucial $155 level again like a wave of positive catalysts that came together. This came after SoFi’s news of the inclusion of SOL among the 30 cryptocurrencies that will be available for trading on its platform, thus opening access to millions of retail investors while Solana ETFs had their tenth consecutive day of inflows. The remaining question confronting traders is: Will this institutional-lifted momentum be able to stand still at $155 where it is meant to be before making the next leap to the resistance cluster around $175?
| Metric | Value |
|---|---|
| Asset | SOLANA (SOL) |
| Current Price | $155.89 |
| Weekly Performance | 0.54% |
| Monthly Performance | -20.91% |
| RSI (Relative Strength Index) | 37.0 |
| ADX (Average Directional Index) | 34.7 |
| MACD (MACD Level) | -10.88 |
| CCI (Commodity Channel Index, 20-period) | -89.40 |
RSI Momentum Signals Room to Run
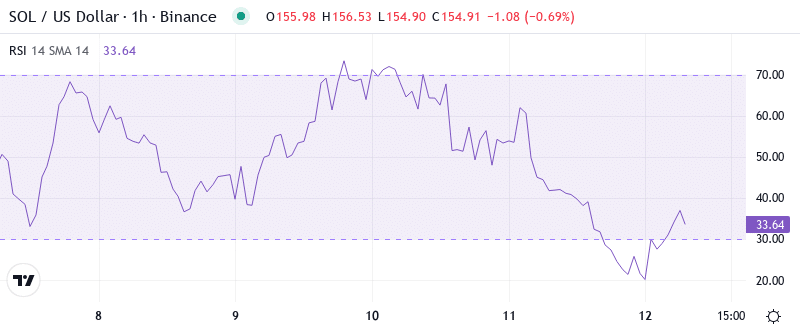
The daily RSI index is presently standing at 49.03, In this way, the SOL is perfectly neutral with the buy and sell orders equally available. This evident occlusion is after the oscillator turned around from oversold conditions under 30 a couple of weeks ago, pointing out the fact that the selling pressure, which was the reason for the December lows, has now been replaced by the new buying interest. The weekly RSI, measured at 42.58, gives a strong echo of this recovery however it is still far from the overbought area of above 70.
The same RSI setups in September were a prelude to SOL’s massive surge to $211, however, the current figures hint we are just at the beginning of this possible rally. This equal RSI indicates to swing traders that they have enough room to move up further before the momentum indicators start to signal warnings. The alignment of flat daily readings with the gradual recovery of weekly momentum suggests a perfect opportunity for building positions, especially as the persistent flow of institutional investments via ETF products is keeping a certain amount of support under the market.
ADX Confirms Trend Acceleration
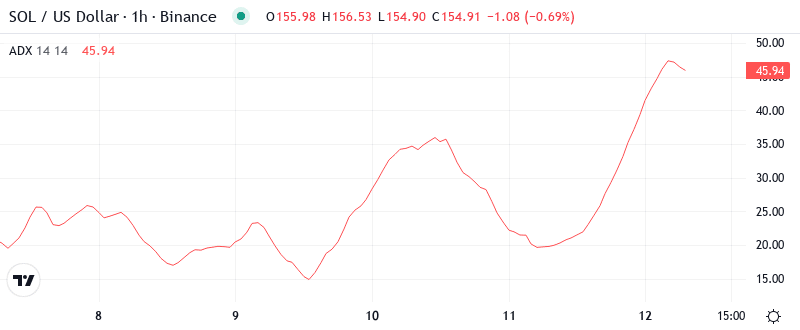
The ADX entry at 34.67 suggests that the trend is building up serious strength, but it has not reached the extremes that are usual for exhaustion point. This reading which was below 25 just last week, jumped up which is the first sign of the market moving away from the choppy consolidation to a directional one. The increase in trend strength perfectly matches Upexi’s announcement of record treasury gains from Solana holdings, which is a clear example of how the positioning of smart money happens usually before the retail investors understand the situation.
The ADX denoted a shift from being in boundary conditions to now being in a trending state indicating the situation is good for momentum strategies rather than mean reversion plays. Day traders should be more adaptive to this type of change, for example, they should ride pullbacks instead of fading strength mainly as a result of the U.S. Treasury’s new law regulations which will allow crypto ETFs to stake assets on top of it as another layer of fundamental support. The ADX 25-40 readings could reflect historically SOL’s most profitable trending periods, so the current suggestion is to keep following the path of the least resistance.
EMA Structure Flips Bullish
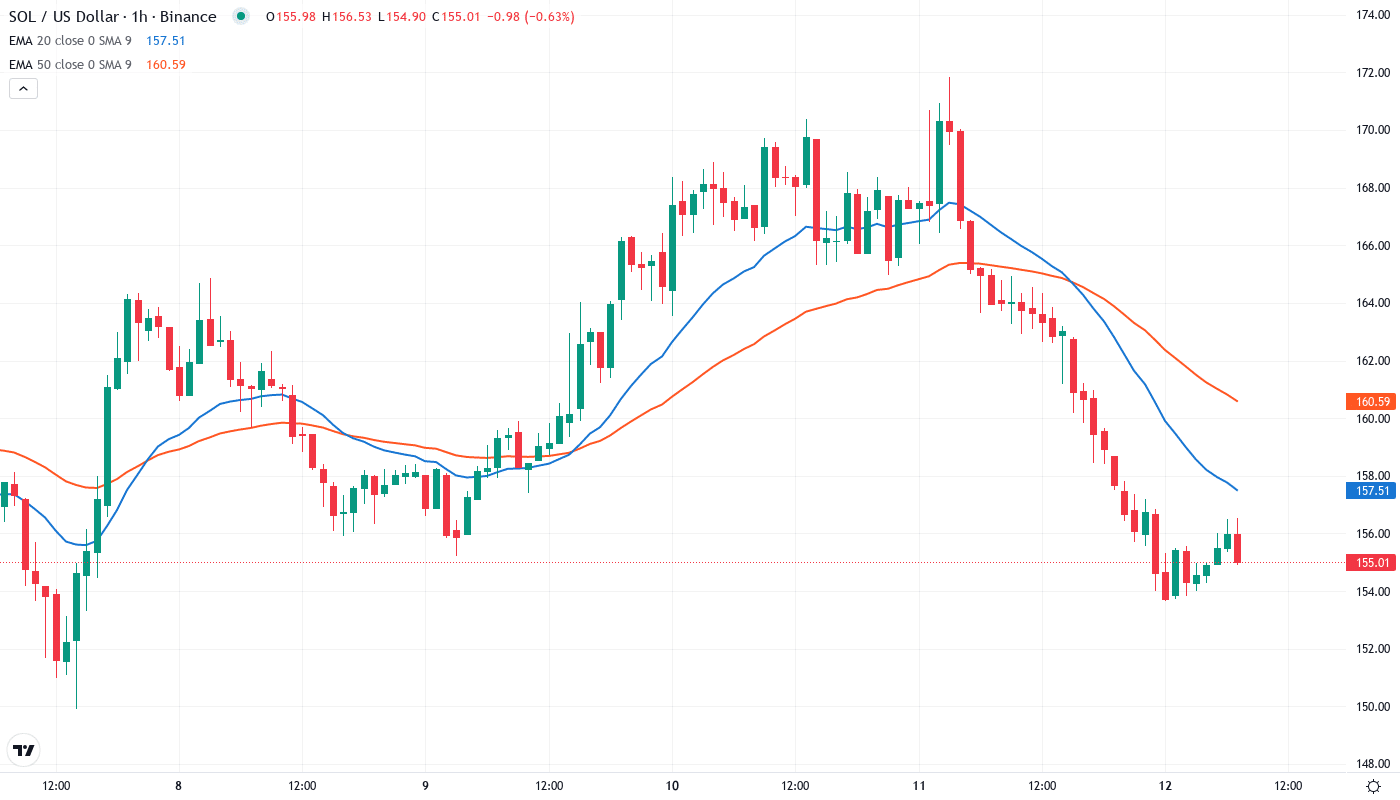
The EMA ribbons crystal clear illustrate the price action of SOL, which is now located above the 10-day ($163.63), 20-day ($172.15), and most importantly, the 50-day EMA at $178.77. Although the price has not yet retrieved the 50-day moving average yet, the quicker rise since the monthly lows has entirely made the short-term averages move from resistance to support. The sequential regain of moving averages shows its pattern before old major rallies.
The 200-day EMA at $184.70 remains as the next significant obstacle, rejecting the advances for three times in December earlier than the current breakdown. The previous resistance zone now becomes the green line for the bulls to beat if they want this pullback to develop into a long-established upward trend. The combination of increasing institutional flows through newly established trade platforms along with improving technical structures indicates that this trial of a move carries more significance than previously unsuccessful attempts.
Critical Zones Define the Battlefield
The short-term resistance zone lies between $175 and $185 which is the overlapping region of the 50-day and 200-day EMAs with December’s breakdown point. This area is a point of interest for both technical analysis traders and long traders as it was the asserted selling level for the short traders in the previous price movement and bulls have to absorb this natural selling pressure. Furthermore, the monthly pivot point at $185.52 makes this resistance band even more significant.
Support structure appears even more powerful than before following the growth momentum of the week, after the first line of defense has been formed at the psychological level of $155 that the asset just reclaimed. Below, the monthly low of $145.96 is the absolute floor that the bulls must defend in order to keep the recovery narrative intact. Any serious break down below $146 will imply that the institutional bid has exhausted and will open the trapdoor down to $131.
The market trend is such that it is the buyers who are having control over it till the time SOL is oscillating above $155 on any pullbacks. With the synergy of the increased institutional interests from different channels like SoFi’s retail onboarding and ETF staking capabilities the Solana ecosystem has a very strong basic environment that is not the same as the one during December’s failed rallies.
Path Forward Crystallizes
To be considered a confirmed breakout, the bulls need to ensure the price closes above $175 on a daily basis whereas the institutional products’ expanding ecosystem continues to act as a constant influencing factor. A strong rally crossing the 50-day EMA level would probably activate the purchase from trend following algorithms mechanically, therefore, increasing the speed of the move to $190, where the weekly resistance level is set.
If the price struggles to break through the EMA cluster and ends up below $155 on volume, it would trigger the bearish domino fall- this would entrap new buyers and potentially lead to a move toward $146. A loss of this kind would demonstrate that the market was unable to maintain higher prices independent of the good news.
Given the existing trajectory along with numerous institutional platforms coming online concurrently, it is most likely for SOL to settle between $155-175 in the near term before it tries to scale the new heights, hence, digesting the gains recently obtained. The junction from the rebounding technical indicators with the additional path for investors through the traditional financiers to enter the market is a scenario for sane grow period more probably than otherwise the big crash.