SOL Climbs 7.22% Weekly Despite December’s 35% Collapse – Recovery Tests Key EMAs
Market Structure Shifts Higher
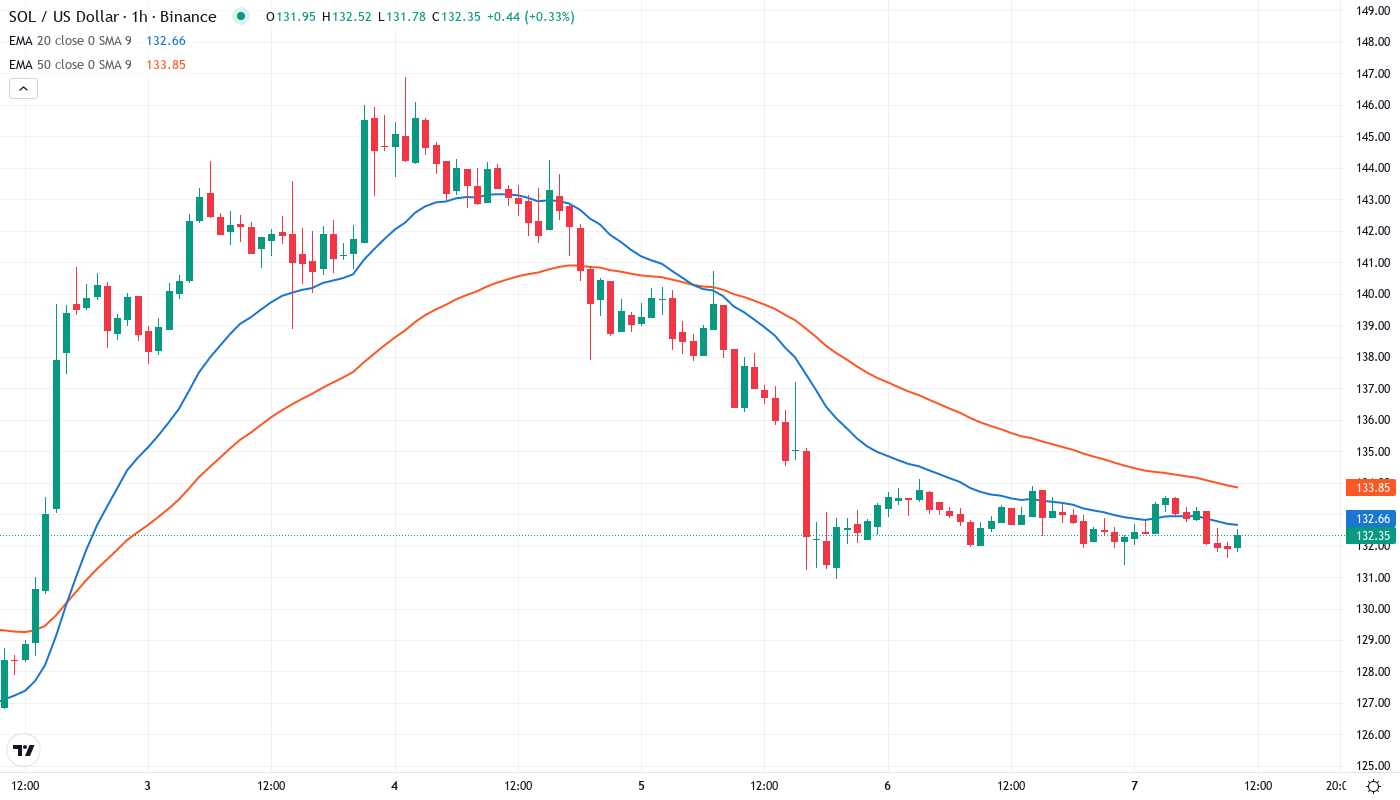
- Solana experienced a 7.22% rebound last week after previously dropping 35% and has now crossed back over the 50-day EMA.
- The RSI declined to 41.6 before rebounding and is currently near neutral levels at 41.6.
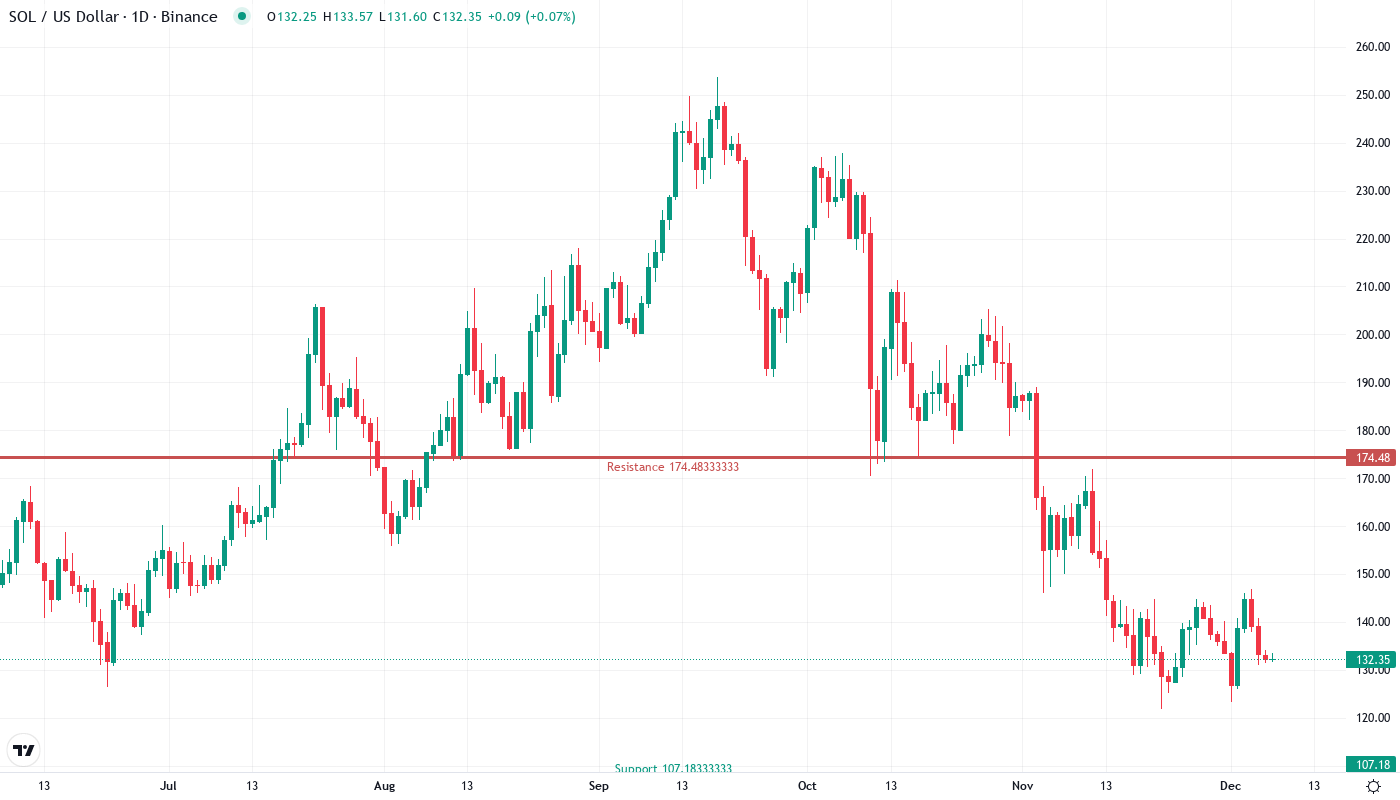
- There is support forming at $115.60, and resistance is strengthening between $154 and highs of last Dec which are close to $172.
The recent pullback erased strong September gains, quickly depleting relative strength and momentum oscillators. This left buyers with rebuilt September + October gaps, which were filled to start December. As seen in August, a breakdown from these gaps could trigger further downside in the short-term. However, bulls continue to hold the May + July gaps, building support against them multiple times this fall. Until sellers send SOL through $120’s support or break beneath the two-month consolidation floor, Solana remains technically neutral-to-bullish. But for traders looking long, stop-losses should be tight beneath Decembers’ post-news lows and psychological level.
| Metric | Value |
|---|---|
| Asset | SOLANA (SOL) |
| Current Price | $132.43 |
| Weekly Performance | -2.62% |
| Monthly Performance | -14.65% |
| RSI (Relative Strength Index) | 41.6 |
| ADX (Average Directional Index) | 34.3 |
| MACD (MACD Level) | -5.84 |
| CCI (Commodity Channel Index, 20-period) | -58.23 |
RSI Resets to 41.6 After Touching Capitulation Territory
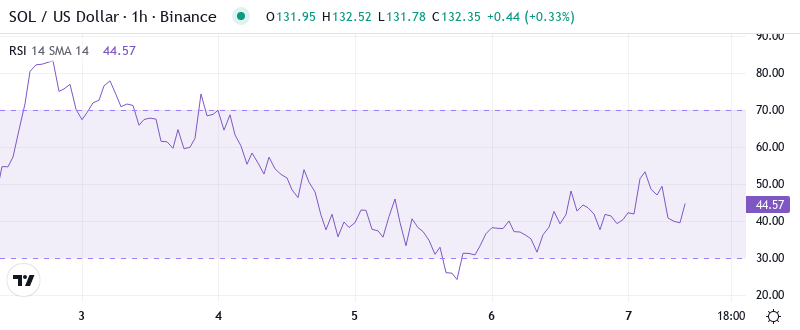
With the oscillator at 41.61 on the daily timeframe, you have the classic reset from oversold conditions that briefly dipped below 40, territory that has marked significant bottoms in August and November. The weekly RSI paints an even more constructive picture at 48.85 and suggests the longer timeframe remains far from exhausted despite December’s brutal selloff.
What is interesting to note is the behavior of RSI during this bounce, it has been making higher lows and higher highs while staying well below the 70 overbought level. This keeps the indicator in a more moderate position and could allow for more room to the upside for price expansion. The increase in the indicator has been steady and hasn’t seen any major jumps, this is considered a healthy sign of accumulation rather than a panic short-covering rally.
ADX at 34.35 Confirms Trend Exhaustion Giving Way to New Direction
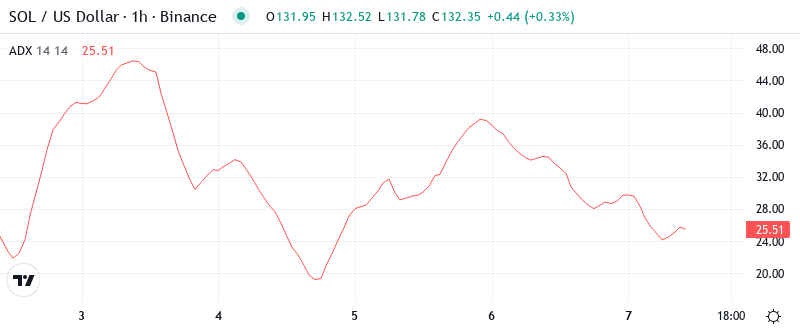
Readings like these warn that the market is vulnerable to a new downdraft and suggest a potential pause in the current upswing. The odds of a downturn increase if prior resistance in the 2600 to 2630 zone turns into new resistance. ADX has now fallen to levels where new uptrends often begin.
Trend followers will be looking for opportunities and levels to measure potential long positions with protection or shorts. Have in mind that should the setup change and all support give way beneath, another strong move lower could occur, invalidating this viewpoint. The market remains ultra-volatile, with large price swings both intraday and more broadly, so short-term trading view adjustments should be anticipated.
50-Day EMA Flips From Resistance to Support in One Week
The weekly relative strength index (RSI) of SOL printed a peak not seen since early September, and the moving average convergence/divergence (MACD) has now favored the bulls three weeks in a row. The January’s decline found support for the second time in as many months at the crucial 78.6 percent Fibonacci retracement level. This kept the pivot low intact which formed back in early December after the all-time high (ATH) breach. The measured went doubled down on the ETH rally in December.
When using longer-term values, we can still detect the 100-day EMA that comes in at $154.60, and the 200-day EMA that’s extended at $115.61, below. The previous resistance and 50-day EMA of $143.93 will now switch to a red line that bulls want to defend on any pullback. The 50-day dynamically moved closer to the 100-day EMA last session, and they have yet to cross over one another for several weeks now. This should continue to put additional pressure on buyers if they fail to maintain the 50-day EMA on a downturn.
Resistance Stacks Between $154 and December’s $172 Peak
There are several resistance levels above the current price that will make it challenging for buyers to prove that the trend is truly reversing. The prices between $154.35 and $154.60 are the first area of resistance. Here, the 100-day EMA is intersecting with the monthly pivot R1 at $148.13. The monthly R1 is at $154.6. The next resistance zone is $171.83, Dec 2027 high. It is almost 30% above the current price.
The bulls are looking to ride the 20-day EMA at $165.18 for support to keep the party going. It marks the best run above that level since last summer, but the more substantial $178-180 area still pays the role of primary resistance until my calculations show $200. If the new yearly-high breakout remains steady, that may take a few days.
Importantly, the market structure looks likely to form an inverse head-and-shoulders pattern with the neckline at $154. A breakout above this level would target $188, but to reach these levels, bulls require sustained demand and positive newsflow from the Solana project updates. While the GlobalFi infrastructure news acted as a start, there needs to be additional organic news.
Bulls Target $154 Breakout While Bears Defend December Range
If SOL can secure a daily close above $154.60, the December high comes into play at $171.83. Beyond that, if the inverse head-and-shoulders pattern is valid, the $188 level is a potential target. The AI-related infrastructure upgrades, as well as the increasing ecosystem activity, offer the kind of solid fundamentals that could drive such a rally. This is particularly likely if sentiment across the broader cryptocurrency market continues to be positive.
If the price fails at the current resistance, there’s a possibility that the bears will take control. In that case, if the price breaks back below the 50-day EMA at $143.93 on volume, this rejection will trap recent buyers who chased the bounce, and that will likely trigger stop-loss cascades toward the $120 support. The Jupiter Exchange risk disclosure issues demonstrate that fundamental concerns still exist, and this would give the bears ammunition to defend overhead supply zones.
Considering the technical reset from oversold conditions and measured momentum readings, the most likely immediate outlook would be for SOL to consolidate in the $143-154 pocket. Such lateral price action would give moving averages the chance to flatline and grant momentum oscillators further room to reset. This establishes the following directional move amid ecosystem advancement and shifting market sentiment.