Shiba Inu Tests Critical Support as Derivatives Launch Fails to Spark Recovery

Market Pulse
- Coinbase Pro listed SHIB and its Perpetual Swaps, as well as spot trading
- Despite market recovery, SHIB posted weekly lows not seen since December 2021
- SHIB dropped 18.2% over the last seven days, consolidating around $0.0000072
Despite Coinbase Pro listing SHIB and its Perpetual Swaps, as well as the spot trading, the market recovery helps the week’s second-worst performer to post weekly lows since stepping to the upside in December 2021.
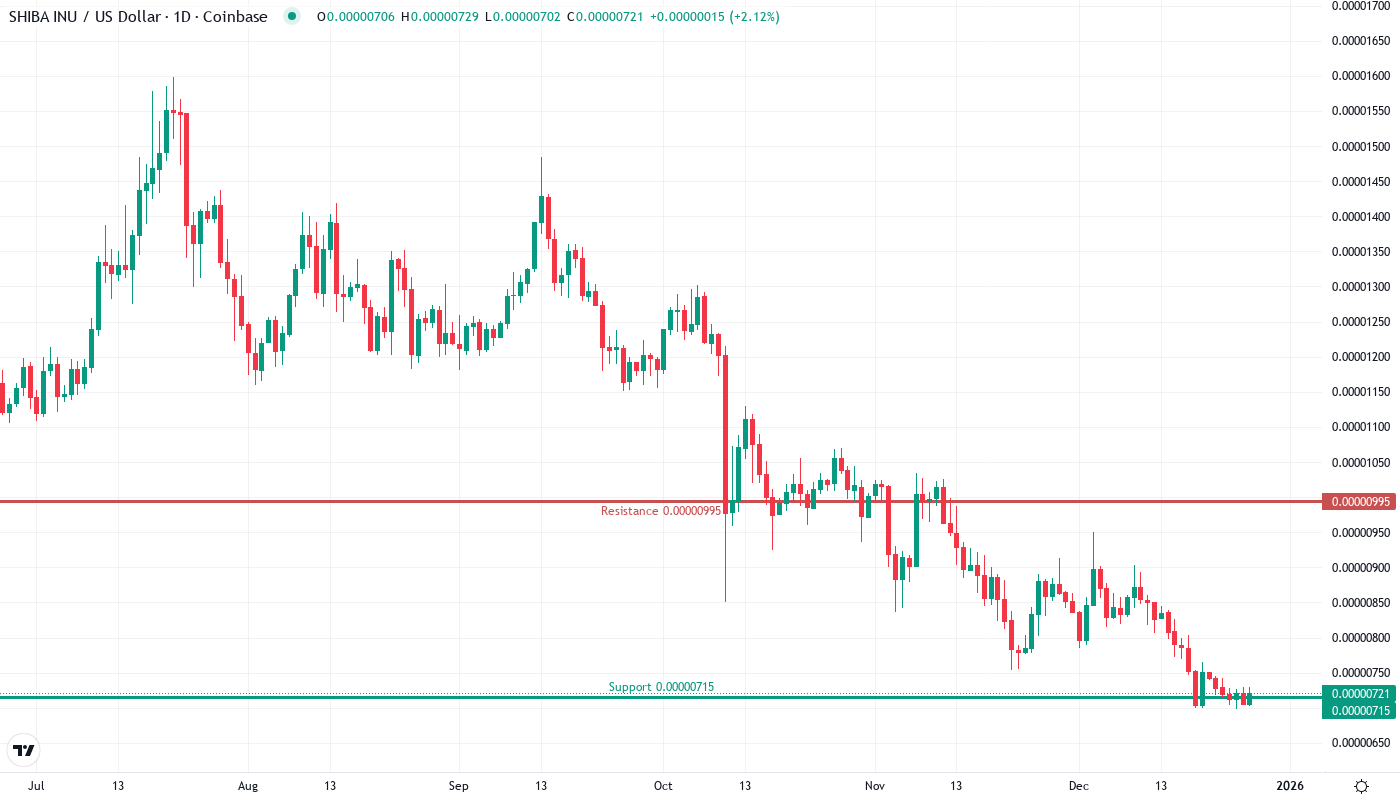
The price movement of Shiba Inu reveals that the positive factors did not help in eliminating the negative ones. As SHIB dropped 18.2% in the last seven days and consolidated around $0.0000072, even the launch of US derivatives on Coinbase, a factor that is usually positive and provides direct access to institutional investors, didn’t prove strong enough to stop the losses. The meme token still lost almost 40% of its value in October. The big question for the traders is whether the ongoing psychological level will be able to provide support or if the bearish sentiment is likely to push SHIB towards $0.000006.
| Metric | Value |
|---|---|
| Asset | SHIBA INU (SHIB) |
| Current Price | $0.00 |
| Weekly Performance | 2.27% |
| Monthly Performance | -18.18% |
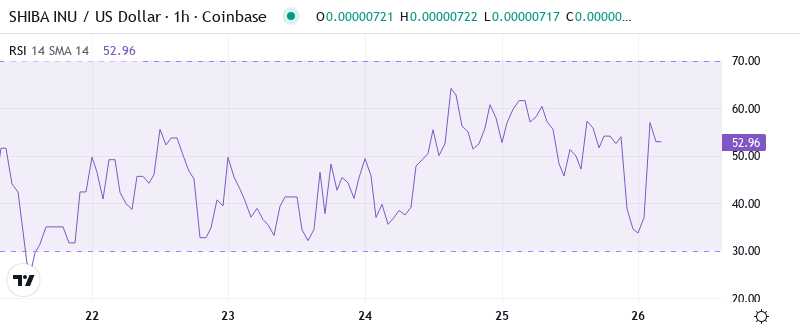
| RSI (Relative Strength Index) | 37.6 |
| ADX (Average Directional Index) | 28.1 |
| MACD (MACD Level) | 0.00 |
| CCI (Commodity Channel Index, 20-period) | -81.60 |
Momentum Exhaustion Signals Capitulation Phase – RSI Matches November Lows
The daily MACD has also experienced its first bullish crossover since early November. While these signals imply the risk/reward dynamics for longs may be tilting in their favor, the absence of prior support levels indicates the potential for additional technical damage should the market make another decisive leg lower.
What is interesting to note is the reaction of RSI to the recent Coinbase news of enabling spot trading of XRP to USD and USDT. Traditionally, this kind of announcement causes an immediate pump in price as market participants scramble to get a piece of the pie and then a dump as they take profits. However, the RSI has not only stayed relatively stable but hardly moved at all. This suggests that the news did not have a significant impact on the price because it was largely already anticipated, or because the broader market conditions simply offset its effect. This also means that for a swing trader like me, this kind of minimal oversold environment can cause a bounce but any rally would quickly face multiple resistance layers without distinctly new positive catalysts.
ADX at 28.1 Confirms Bears Control the Trend – Not Just Noise
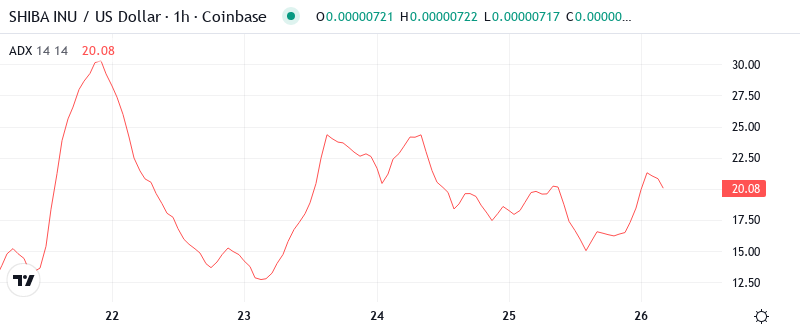
By measuring the strength of a trend rather than its direction, the ADX can be a vital part of how an investor decides to allocate capital. Though not the most complicated indicator to understand or employ, the ADX is powerful when used correctly. This move up means downside momentum is increasing.
The increase in ADX from under 20 to where it is at now comes at the exact time we saw the break below $0.000009, so not a case of profit taking barring this back up but one of the market dynamics changing for the worse. Just to be aware that while when altcoin volumes 4x those of Bitcoin, bottom accumulation is across the board; SHIB’s ADX is warning us that the selling pressure is not exhausted and rather that it is currently intense and driven by conviction.
20-Day EMA at $0.0000072 Becomes Final Stand for Bulls
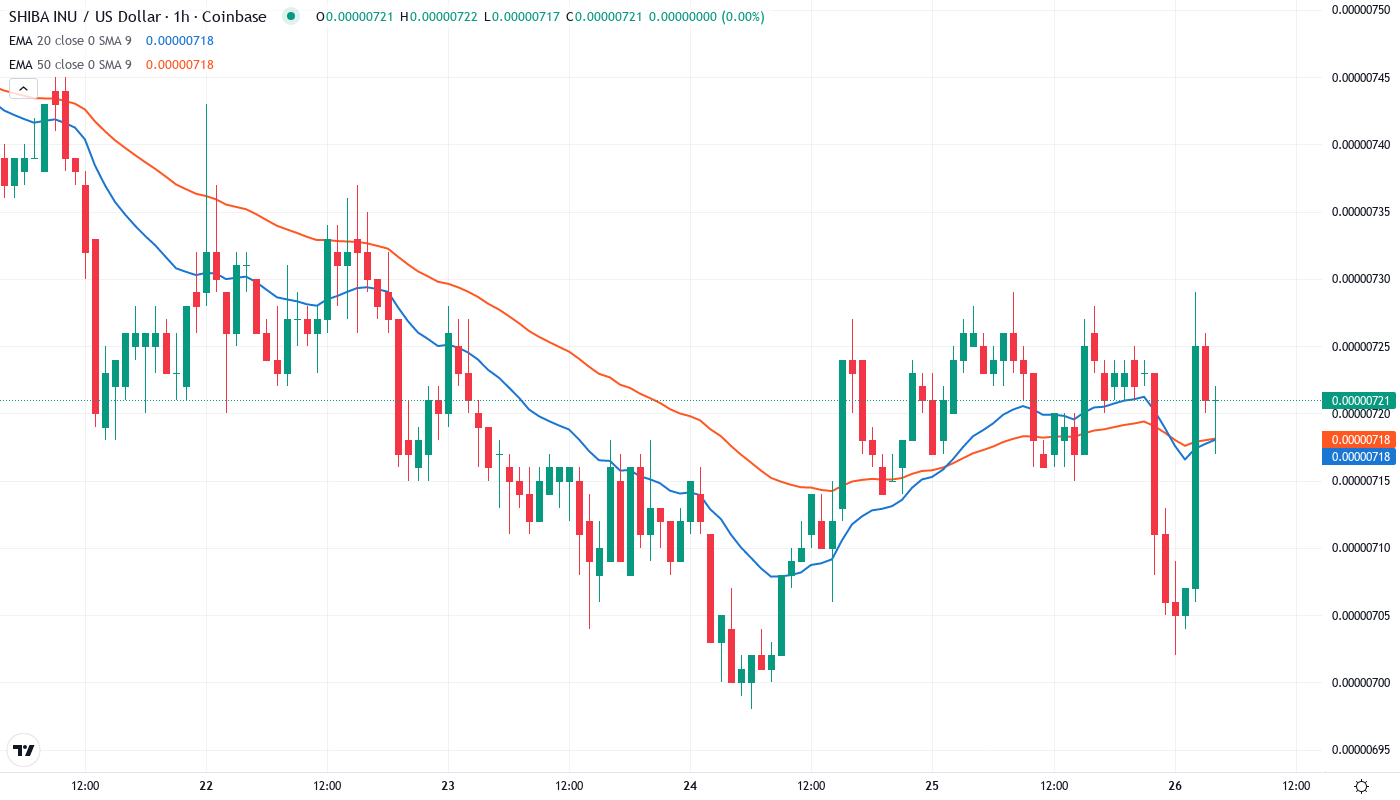
The Stochastic RSI has now reset and will likely make an attempt to cross bullish in the oversold region. SHIB price remains at the whims of Bitcoin and Ethereum but more closely tracks the performance of Dogecoin. Volume has waned significantly, and any price movement on SHIB has the potential to reverse quickly without a consistent tape.
What is more important is the squeeze underway between the 20-day and 30-day EMAs which are now less than 10% apart from each other. Strong compression between those two is typically a sign of an imminent outbreak and as price is waddling its way beneath most of the ribbon, the most likely direction is downwards. The weekly 20-EMA at $0.0000099 as the tape massive resistance – a level that refused to raise 3 times over the past month before the release of the derivative news failed to provide enough steam for a fourth test.
Support Architecture Crumbles as $0.0000072 Becomes Make-or-Break Zone
Sellers have placed tough resistance above the current price levels, ranging from $0.0000079 (weekly pivot point) to the psychologically significant $0.000010 mark at December’s high. The monthly pivot point at $0.0000087 serves as the mid-point of this resistance zone. It would be extremely improbable that the buying interest generated from the news of positive derivatives would be able to muster up the required volume to break through this selling pressure.
Bulls are now trying to defend the $0.0000072 support level with greater urgency. The $0.0000072 level has shifted from a minor pivot to the final support. If this support cracks, an air pocket exists down to $0.0000064 where the monthly S1 pivot is located, or 11% lower. The weekly S1 support is at $0.0000071, offering marginal support just below the current levels.
The crypto’s price is currently hovering around $0.0000074, slightly above the $0.0000072 support level. If this level is breached, the next area of interest would likely be around $0.0000065. Conversely, breaking above the $0.0000076 resistance could trigger a short-term rally.
Bears Target $0.000006 Unless Bulls Reclaim $0.000008 Decisively
If SHIB manages to recover above $0.000008 and close the day above this level, it will turn the 10-day EMA into support, which is a positive sign. In this case, the next level to watch is the 50-day EMA at $0.0000084. However, for this to happen, SHIB will either need additional support from the overall altcoin market (indicated by the 4x surge in trading volume) or some new SHIB-related fundamental developments that the market has not yet priced in post derivatives launch.
Should $0.000006 fail to hold, there is literally zero support until the level of $0.0000038!! This is a worst-case scenario and not my main read, although it is nonetheless a reminder that if and when a sharp breakdown occurs, the altcoin cleanup will be capped at the earlier April low. Substantial strength slowly building underneath and looking for high or low shakeout before the next upswing.
Despite the good news and signals that show there is a trend change and they need to take advantage of it, price increase, media exposure, accommodations with more exchanges/access and use will all be positive for SHIBA INU in the long term.