Render Token Plunges 11.8% Weekly as Upbit Hack Shakes Confidence Despite AI Growth
Market Pulse
- RENDER drops to $1.79 after security breach hits major exchange holdings
- AI compute infrastructure shows resilience with accumulation signals emerging
- Technical structure deteriorates but critical support at $1.69 still holds
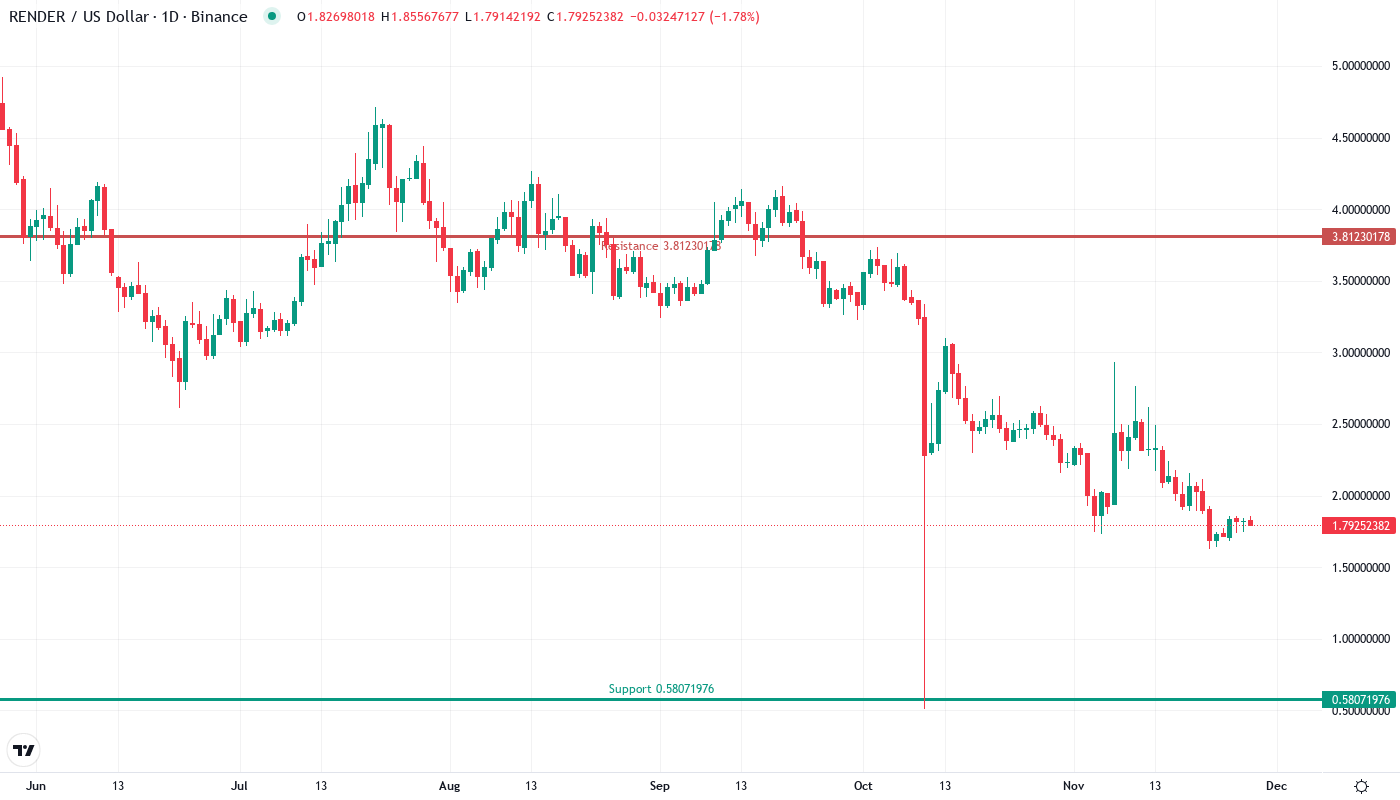
Render Token has taken a devastating hit this week, tumbling 11.8% to $1.79 as the Upbit exchange hack sent shockwaves through holders. The $36 million security breach that included RENDER among the stolen assets has erased confidence built during recent AI infrastructure growth announcements, with the token now down 28.2% monthly and a crushing 75.9% from yearly highs. The main question for traders is: can the accumulation zone identified between $3.20-$3.40 still matter when price has collapsed this far below it?
| Metric | Value |
|---|---|
| Asset | RENDER (RENDER) |
| Current Price | $1.79 |
| Weekly Performance | -11.79% |
| Monthly Performance | -28.16% |
| RSI (Relative Strength Index) | 38.6 |
| ADX (Average Directional Index) | 18.7 |
| MACD (MACD Level) | -0.17 |
| CCI (Commodity Channel Index, 20-period) | -72.35 |
Momentum Exhaustion Signals Capitulation Phase Near Completion
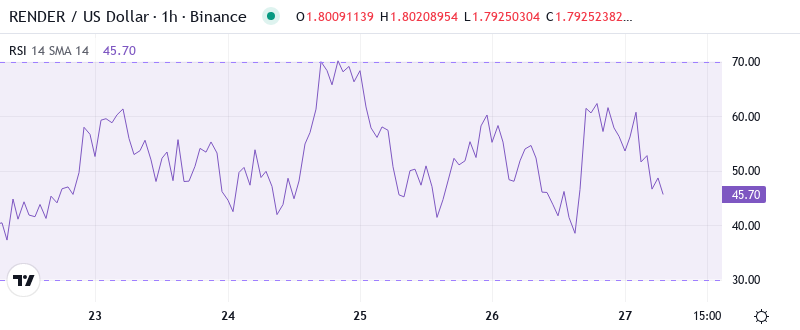
RSI sits at 38.62 on the daily timeframe, diving into oversold territory that hasn’t been seen since the August washout. This capitulation-level reading follows last week’s security-driven panic selling, where the Upbit hack news triggered algorithmic dumps across affected tokens. Similar oversold configurations in September preceded a 40% relief rally within two weeks, though that occurred without the overhang of stolen token liquidation risk.
What’s revealing is how RSI barely budged from 33.1 on the weekly timeframe despite the dramatic price collapse—suggesting longer-term momentum remains relatively stable compared to the daily panic. So for swing traders, this divergence between timeframes means the daily oversold bounce could arrive soon, but weekly structure warns against expecting sustained recoveries until the 50 RSI level flips back to support around $2.30.
Weak ADX at 18.68 Confirms Range-Bound Chop Ahead
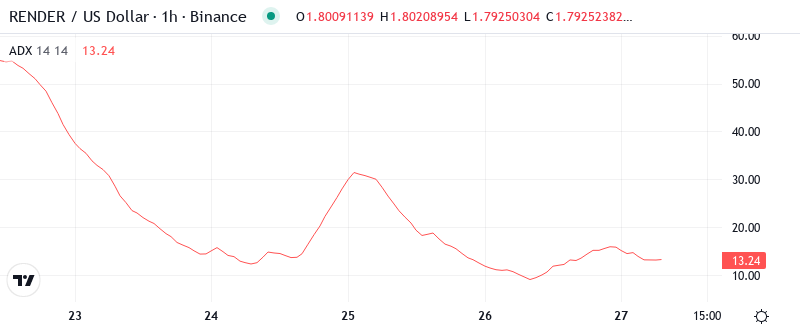
Looking at trend strength, the ADX reading of 18.68 signals pure consolidation mode with neither bulls nor bears commanding directional control. The indicator has actually dropped from higher readings during the sell-off, which typically happens when panic exhausts itself into sideways grinding. Basically, being in this sub-20 zone means the trending algorithms have switched off and range traders now dominate the action.
To clarify, the ADX is indicating that despite the severity of the recent drop, we’re transitioning from trending conditions to boundary-bound price action. This shift usually coincides with accumulation phases, which aligns with the earlier analysis suggesting smart money might be positioning in the aftermath of the hack-induced capitulation. Therefore, day traders should adjust strategies from trend-following to mean reversion setups between support and resistance levels.
Former Support at 20-Day EMA Now Caps Recovery Attempts
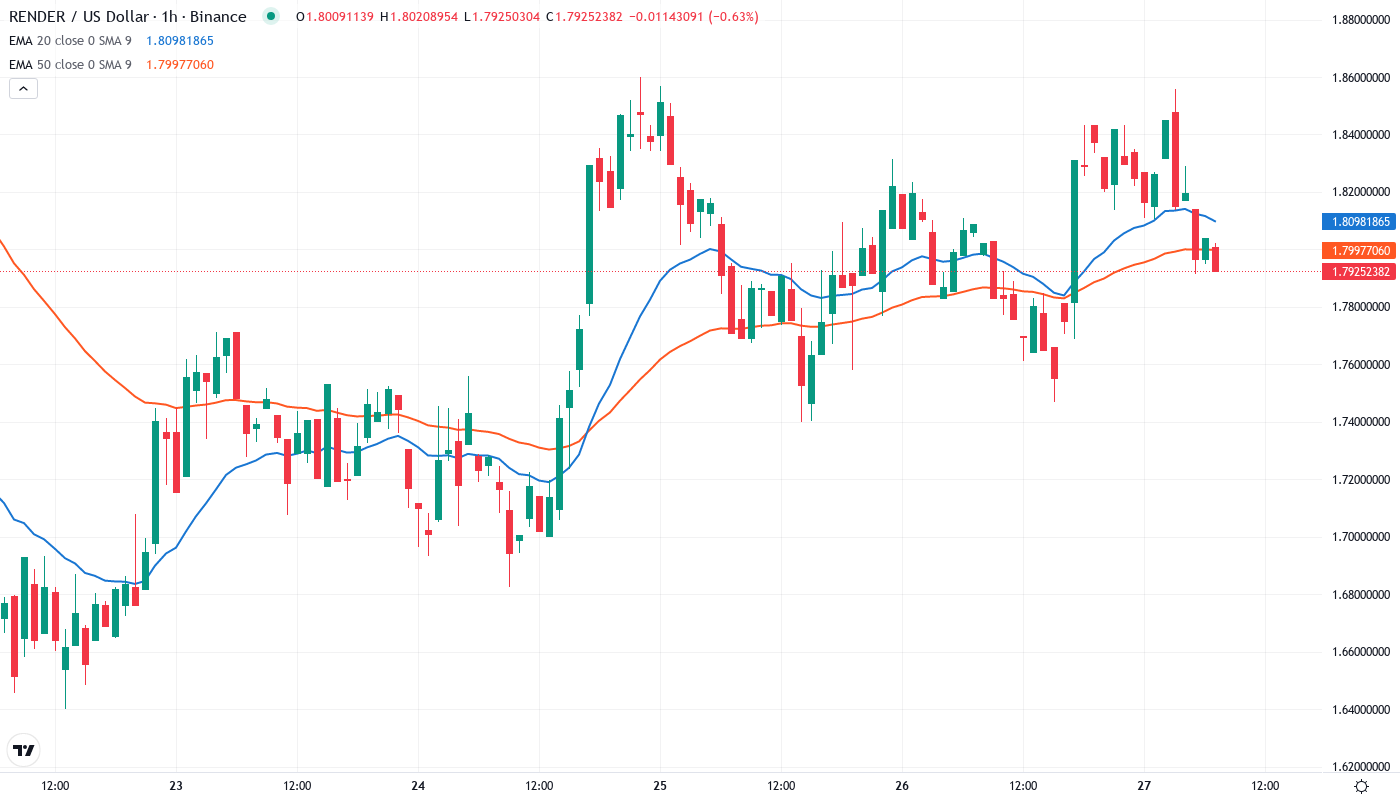
Price action tells a stark story through the EMA ribbons. RENDER trades far below the entire moving average stack, with the 10-day EMA at $1.86 and 20-day at $1.98 both acting as overhead resistance after the security breach broke their support. More concerning, the 50-day EMA sits way up at $2.33, roughly 30% above current levels—that’s a massive gap that reveals the violence of this decline.
The 100-day EMA at $2.76 and 200-day at $3.32 might as well be on another planet at this point. What’s significant is the compression that was building between the shorter-term EMAs before the hack news hit—price had been coiling tightly around the $2.00 level. That former consolidation zone from $1.98–$2.10 now transforms into major resistance that bulls must reclaim to even begin discussing recovery scenarios.
Monthly Support at $1.69 Becomes Final Defense Line
Above current levels, sellers have stacked multiple resistance layers between the monthly pivot at $2.31 and the weekly R1 at $2.61. The immediate hurdle sits at $1.86 where the 10-day EMA converges with psychological round numbers. But the real battle zone extends from $1.98 to $2.10, where the 20-day EMA meets December’s pre-hack consolidation area—any relief bounce will face heavy supply here from trapped longs seeking exits.
Bulls now guard the monthly S1 support at $1.69, which has emerged as the critical line after this week’s flush. This level gains extra significance from being near the psychological $1.70 area and representing a 40% retracement from November highs. The next major support waits down at the monthly S2 around $1.23, but losing $1.69 would likely trigger another capitulation wave as stop-losses cascade.
Crucially, the market structure shows that despite the hack-driven devastation, buyers stepped in aggressively at $1.63 during the initial panic. This rejection from the yearly support zone suggests institutional accumulation may be occurring, especially given the positive AI infrastructure developments that preceded the security incident. The wide gap between current price and the 50-day EMA creates an unusual vacuum that typically gets filled, though the timeline depends on resolving the stolen token overhang.
Relief Bounce to $1.98 Most Probable Before Reality Check
Bulls require a decisive daily close above $1.86 to signal the oversold bounce has begun, targeting the 20-day EMA at $1.98 as the first meaningful resistance. The combination of oversold RSI readings and the ADX showing exhausted selling pressure supports this relief rally scenario, especially if updates on the hack recovery provide positive catalysts.
The bearish reality check arrives if price fails to reclaim $1.86 after multiple attempts, confirming the 10-day EMA as resistance. Should the critical $1.69 support break on volume, the resulting stop-loss cascade would likely flush positions down to $1.23 or lower, particularly if stolen RENDER tokens begin hitting the market. This scenario gains probability if the weekly RSI drops below 30, signaling multi-timeframe capitulation.
Given the oversold daily conditions but damaged weekly structure, the most likely path sees RENDER bouncing to test $1.98 resistance before reality sets in about the overhead supply. Without resolution on the hack’s aftermath and concrete AI adoption metrics to offset the security concerns, expect choppy consolidation between $1.69–$1.98 while the market digests whether the 75% yearly decline has finally found a floor.