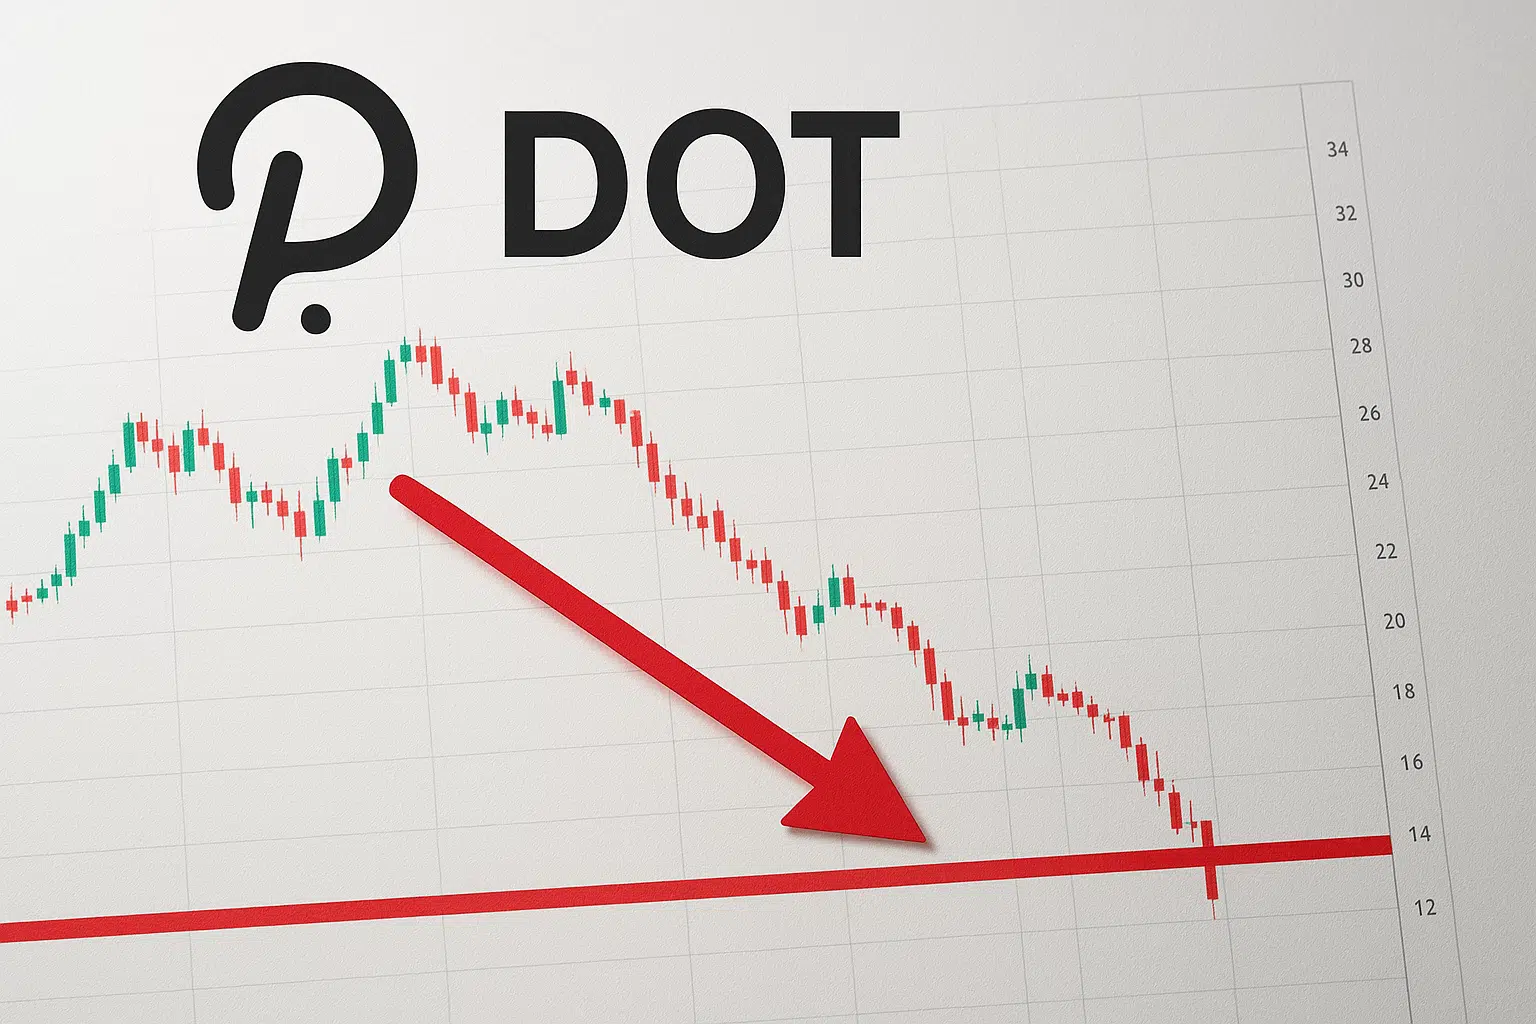
Polkadot Tests Critical Support After ETF Inclusion Fails to Spark Rally
Market Structure Shifts Lower
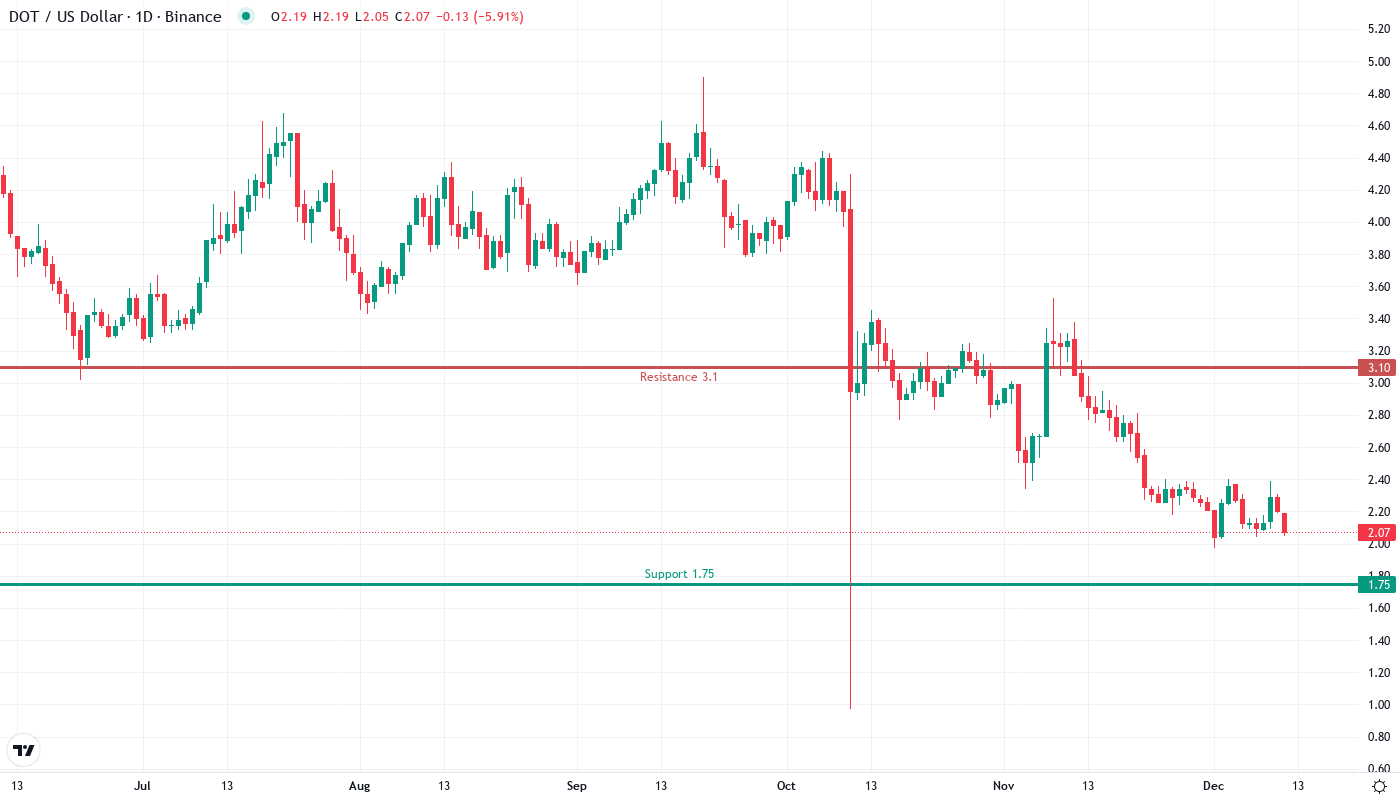
- DOT slides 12.7% weekly despite joining Bitwise’s NYSE-traded crypto index fund
- Multiple support levels cluster between $2.00-$2.18 as bears push for yearly lows
- ADX at 34.5 signals genuine trending conditions – range traders should step aside
Polkadot’s price action tells a sobering story this week, with DOT shedding 12.7% to trade at $2.07 despite what should have been bullish news flow. The cryptocurrency’s inclusion in Bitwise’s newly launched NYSE-traded crypto index fund – marking the first major ETF to feature DOT alongside Avalanche and Sui – failed to provide any meaningful bid support as sellers defended the $2.50-$2.60 resistance zone aggressively. The main question for traders is: can bulls defend the psychological $2.00 level, or will the ETF inclusion become another “buy the rumor, sell the news” scenario that traps late buyers?
| Metric | Value |
|---|---|
| Asset | POLKADOT (DOT) |
| Current Price | $2.07 |
| Weekly Performance | -12.66% |
| Monthly Performance | -36.70% |
| RSI (Relative Strength Index) | 37.9 |
| ADX (Average Directional Index) | 34.5 |
| MACD (MACD Level) | -0.15 |
| CCI (Commodity Channel Index, 20-period) | -116.70 |
RSI at 37.87 Approaches Oversold Territory – Capitulation Risk Building
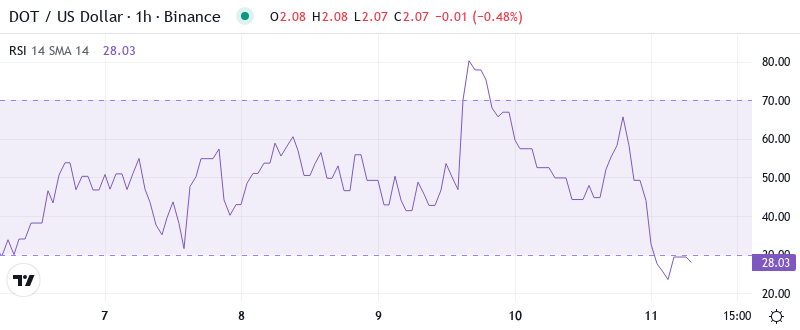
RSI sits at 37.87 on the daily timeframe, rapidly approaching the oversold threshold of 30 that typically marks capitulation phases. What’s revealing is how momentum deteriorated so quickly – just two weeks ago, the oscillator read above 50, suggesting balanced conditions. This swift momentum collapse mirrors the price action from November when RSI dropped from 45 to 28 in a similar timeframe before DOT found its floor.
For swing traders eyeing a potential bounce play, the current RSI configuration suggests patience is warranted. Similar oversold readings in August preceded a 35% relief rally, but crucially, those bounces came after RSI actually pierced below 30 and showed positive divergence. So for now, the momentum picture remains firmly bearish with room for further downside before any sustainable reversal signals emerge.
ADX Climbs to 34.53 – Trending Market Replaces December’s Chop
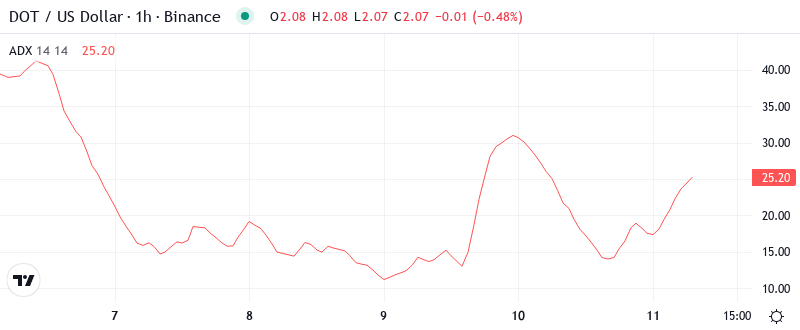
Looking at trend strength, the ADX reading of 34.53 indicates we’ve shifted decisively from range-bound conditions into a trending market. During most of December, ADX languished below 25, keeping price action contained in predictable ranges that rewarded mean reversion strategies. That’s no longer the case – the surge in directional movement means range-trading setups are now fighting the tape.
To clarify, an ADX above 30 typically signals conviction behind the dominant trend, which unfortunately for bulls, points decisively lower. Trend followers should align with this bearish momentum rather than attempting counter-trend positions. The last time ADX sustained readings above 35 was during October’s washout from $4.50 to $3.50, offering a roadmap for how extended these directional moves can become once momentum builds.
20-Day EMA at $2.28 Caps Recovery Attempts After Support Flip
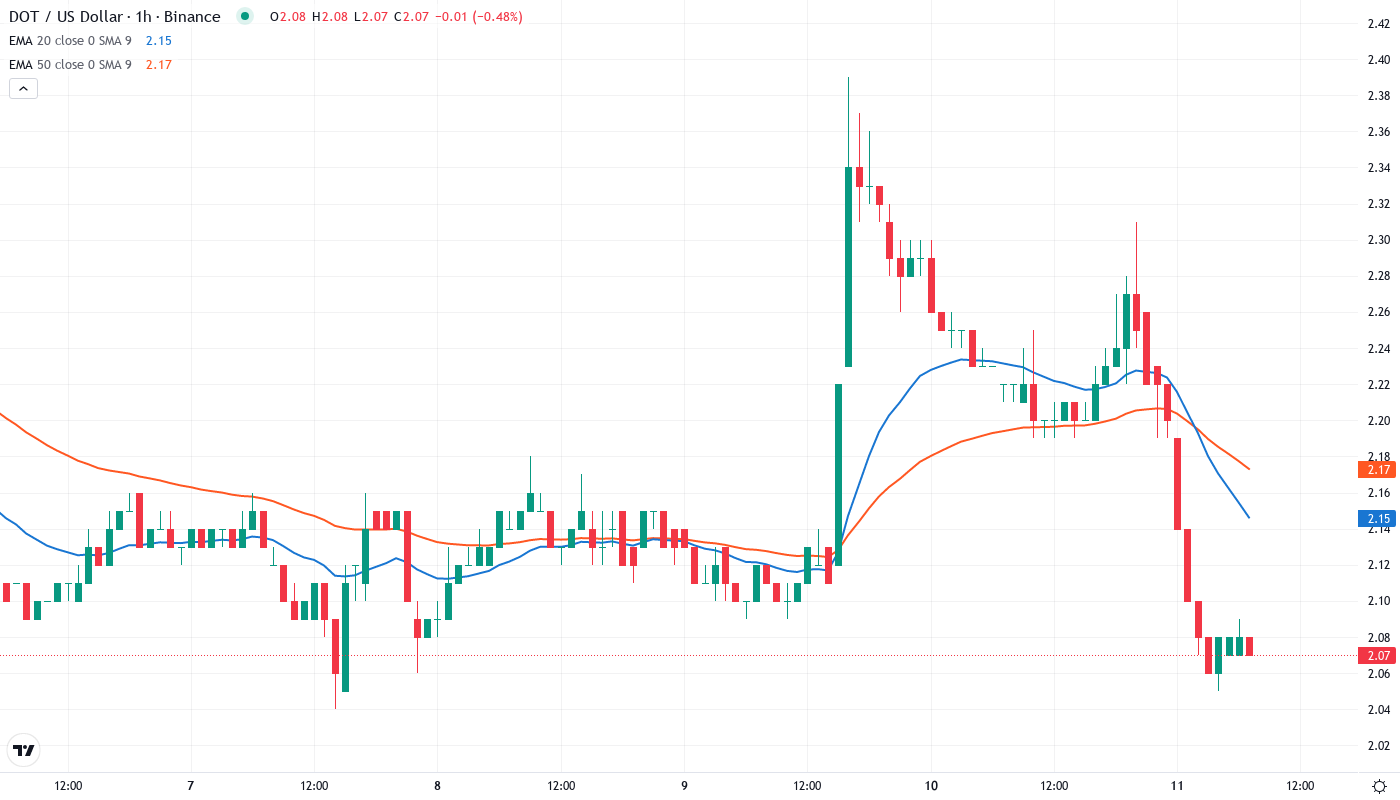
Price action through the EMA ribbons paints a clear bearish structure. DOT trades below every significant moving average – the 10-day ($2.19), 20-day ($2.28), and critically, the 50-day EMA at $2.61. Each of these levels rejected rally attempts over the past week, with the 20-day EMA proving particularly stubborn resistance during Tuesday’s failed recovery attempt.
More concerning for bulls is how the 50-day EMA flipped from multi-month support to resistance following the ETF announcement. This level at $2.61 had provided reliable bounces throughout November and early December. Its transformation into resistance suggests the broader trend structure has shifted bearish, with former support zones now acting as overhead supply. Bulls need to reclaim at least the 20-day EMA to signal any potential for trend reversal.
Support Stacks From $2.00 Psychological to $1.75 Multi-Month Low
Below current levels, support appears limited but concentrated at psychologically significant zones. The immediate support sits at the round number $2.00 level, which carries both technical and psychological weight. This zone hasn’t been tested since November’s capitulation phase, making it a critical line for bulls to defend with conviction.
Should $2.00 fail, the next substantial support emerges at $1.75, marking the 2024 low set during August’s market-wide deleveraging event.
Between these levels lies a concerning air pocket with little historical volume, suggesting any breakdown below $2.00 could accelerate quickly toward that yearly floor. The lack of intermediate support between $2.00 and $1.75 makes the current level particularly crucial – lose it, and there’s little to slow the descent.
The market structure reveals seller control as long as price remains below $2.28 (20-day EMA). Each bounce attempt this week attracted fresh selling pressure, with lower highs forming a clear descending pattern. This configuration suggests distribution rather than accumulation, warning that any relief bounces will likely face immediate resistance unless accompanied by significant volume expansion.
Bulls Must Reclaim $2.28 to Shift Momentum From Bearish Spiral
Bulls require a decisive daily close above $2.28 to neutralize the immediate bearish pressure and open potential for recovery toward $2.61. Such a move would need to be accompanied by expanding volume and ideally, some positive catalyst beyond the existing ETF narrative which markets have already digested. Without reclaiming the 20-day EMA, any bounces will likely prove fleeting.
The bearish scenario accelerates if DOT loses $2.00 support on volume, particularly on a daily close. This would confirm the ETF inclusion as a “sell the news” event, potentially triggering stop-loss cascades from late buyers positioned above $2.20. A breakdown here targets $1.75 next, with little technical support to slow the decline given the air pocket in market structure.
Given the trending conditions confirmed by ADX and the failure of bullish news to stem selling pressure, the most probable near-term path sees DOT testing the $2.00 psychological support within days. Whether this level holds will determine if December’s correction finds a floor or extends toward August’s $1.75 low – making it the key battleground for both bulls and bears in the sessions ahead.