Polkadot Tests Critical $2 Support as ETF Inclusion Fails to Spark Recovery

Market Structure Shifts Lower
- DOT slides to $2.00, erasing 30% in a month despite new Bitwise ETF inclusion
- Technical indicators flash oversold with RSI at 36.36 on daily timeframe
- Bulls defend psychological $2 level six times as Wyckoff analysis suggests potential bottom
Polkadot’s price action tells a sobering story as DOT tumbled to $2.00, marking a devastating 30% monthly decline that wiped out three months of gains. The collapse comes despite Bitwise launching the first major ETF to include DOT alongside Avalanche and Sui on the NYSE – a development that typically provides wind to the sails but instead met aggressive selling pressure. The main question for traders is: Can the psychological $2 level hold after six tests, or will bears finally break through to trigger cascading stop losses below?
| Metric | Value |
|---|---|
| Asset | POLKADOT (DOT) |
| Current Price | $2.00 |
| Weekly Performance | -6.10% |
| Monthly Performance | -29.82% |
| RSI (Relative Strength Index) | 36.4 |
| ADX (Average Directional Index) | 34.2 |
| MACD (MACD Level) | -0.15 |
| CCI (Commodity Channel Index, 20-period) | -125.13 |
RSI Drops to 36.36 – Matching August’s Capitulation Zone
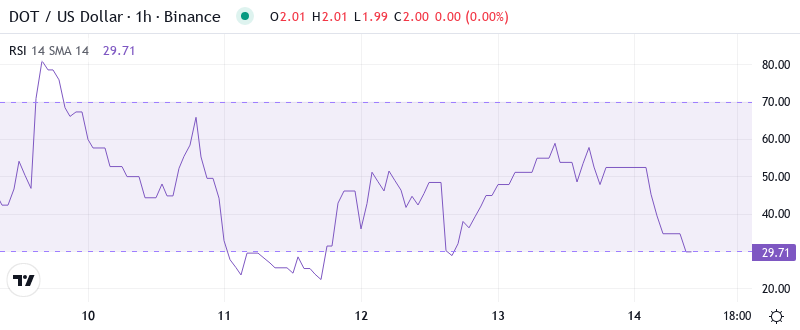
Reading the oscillator at 36.36, traders see momentum exhaustion that historically marked significant bottoms for DOT. This oversold condition matches levels last witnessed during August’s washout when price found its footing near current levels before staging a 40% relief rally. The weekly RSI paints an even grimmer picture at 32.16, signaling capitulation on higher timeframes that typically requires weeks to reset.
What’s revealing is how RSI behaved during the ETF announcement – instead of momentum building, the oscillator continued its descent from December’s 53.88 reading. So for swing traders, this deeply oversold RSI combined with the psychological $2 support creates a high-risk, high-reward setup where any positive catalyst could spark a violent snapback rally. The key lies in watching whether daily RSI can reclaim 40 to confirm sellers are exhausted.
ADX at 34.21 Confirms Bears Control the Trend
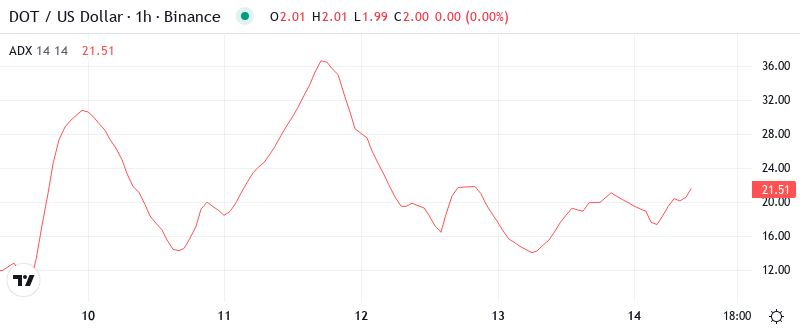
At the level of 34.21, the ADX entry indicates that the trend is gaining power and conviction behind this selloff remains strong. Basically, being in this zone above 30 means directional movement dominates over consolidation, and right now that direction points decisively lower. The reading climbed from 25 just two weeks ago, accelerating as price broke through multiple support levels despite the ETF inclusion news.
To clarify, the ADX is indicating that range-trading strategies should take a backseat to trend-following approaches. Therefore, day traders should suit their strategies to this change – either joining the bearish momentum with tight stops or waiting for ADX to drop below 25 before attempting countertrend longs. The combination of oversold RSI with strong ADX creates a divergence that often precedes sharp reversals, but patience remains crucial until trend strength wanes.
20-Day EMA at $2.33 Becomes Resistance After December Breakdown
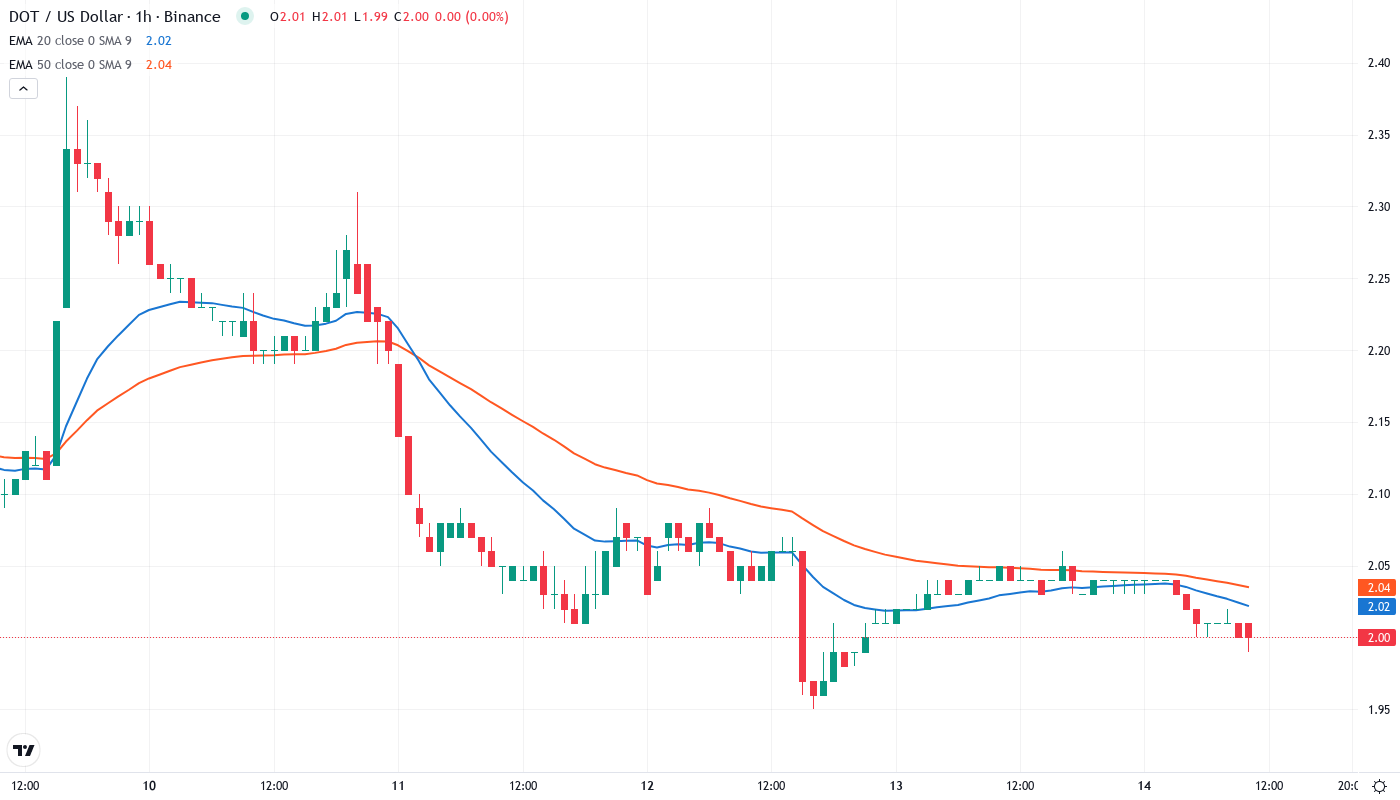
Price action is very clear through the EMA ribbons. DOT trades below the entire moving average stack – trapped beneath the 10-day ($2.11), 20-day ($2.21), and crucially the 50-day EMA at $2.55. This complete breakdown of the moving average structure occurred despite institutional interest via the Bitwise ETF, suggesting deeper structural issues beyond short-term sentiment.
Looking at the weekly timeframe, the situation grows more concerning with price sitting below the 10-week ($2.67) and 20-week ($3.15) EMAs. The 50-day EMA changed from being a support level to a resistance one after three failed reclaim attempts in December, and now acts as a ceiling near $2.55. That former support area now transforms into a red line for the bears to defend – any sustained move above would signal potential trend reversal.
Support Tested Six Times at $2.00 While Resistance Stacks Above
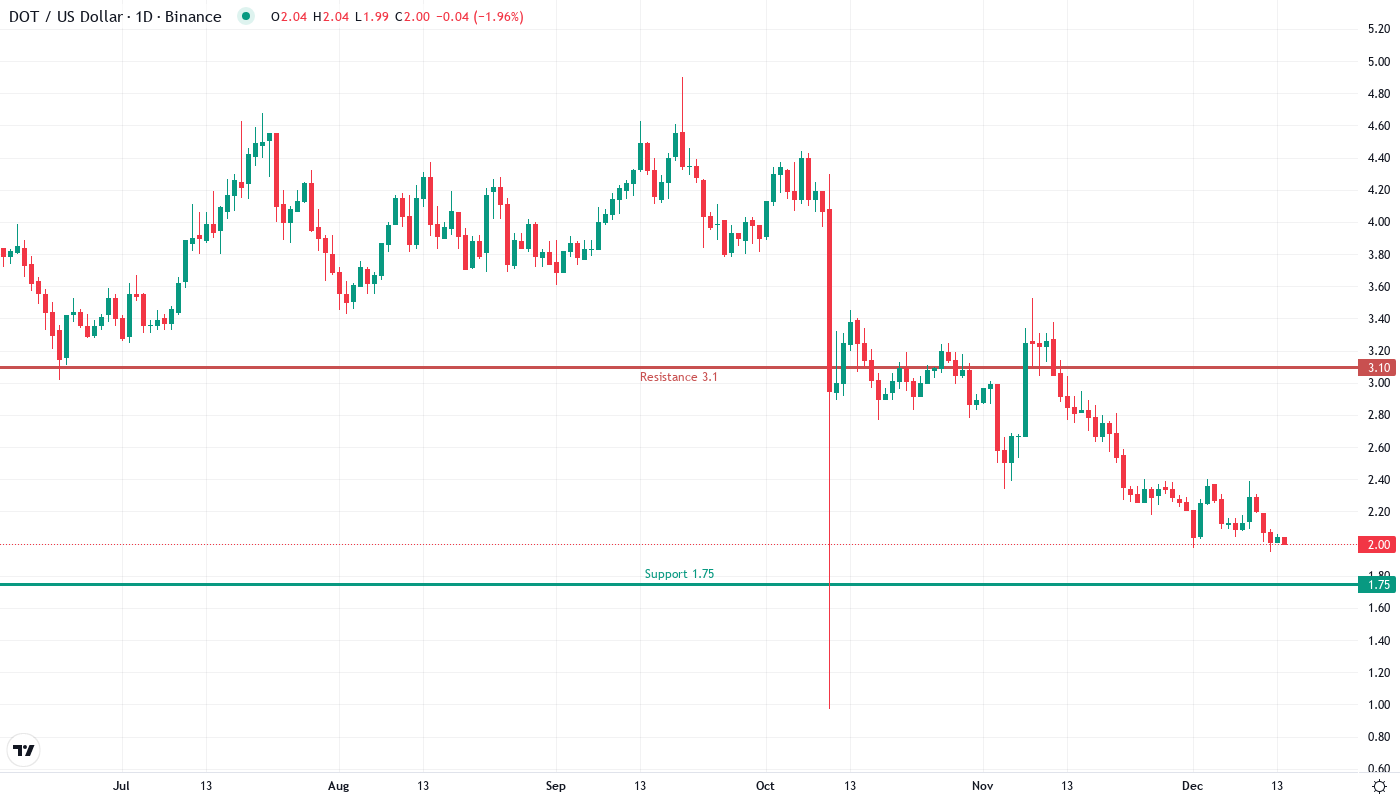
The immediate resistance clusters between $2.33 (20-day EMA) and $2.55 (50-day EMA and monthly pivot), creating a formidable barrier for any recovery attempt. Above that, sellers have stacked additional resistance at the weekly pivot ($2.64) and the psychological $3.00 level where December’s highs peaked. The Bitwise ETF announcement briefly pushed price toward $2.40 before sellers emerged with conviction.
Bulls defend the psychological $2.00 level with surprising resilience – six touches since November without a decisive breakdown. The support line now looks more fragile with each test, especially as volume declined on recent bounces. Below $2.00, the next meaningful support waits at $1.75 (monthly S1) followed by the yearly low near $1.29, representing another 35% downside if current support fails.
Crucially, the market structure reveals a descending triangle pattern with lower highs since December while $2.00 acts as the horizontal base. This configuration typically resolves to the downside unless bulls can reclaim the 20-day EMA soon. The Wyckoff analysis suggesting a potential bottom adds weight to the $2.00 defense, but technical evidence currently favors bears.
Bulls Need Daily Close Above $2.33 to Shift Momentum
Bulls require a decisive close above the 20-day EMA at $2.33 to invalidate the bearish structure. Should price reclaim this level and hold for multiple daily closes, targets would shift to the 50-day EMA at $2.55 where heavier resistance waits. The ETF inclusion provides a fundamental catalyst, but technical buyers need confirmation above key averages.
The bearish scenario triggers if $2.00 support finally cracks on volume after six tests. This breakdown would likely flush positions down to $1.75 initially, with potential continuation toward the $1.29 yearly low if selling accelerates. Bears gain confidence with each failed bounce attempt at current levels.
Given the oversold conditions meeting strong support after a 30% monthly decline, the most probable near-term path is a relief bounce toward $2.20-2.33 before sellers reemerge at the 20-day EMA. The ETF catalyst arrived too early to reverse the technical damage, requiring time and base-building before any sustainable recovery.