Polkadot Tests Critical $2 Support as ETF Inclusion Fails to Spark Recovery

Market Structure Shifts Lower
- DOT plunges 38% in December despite institutional ETF inclusion
- Six consecutive monthly declines push price to 75% below yearly highs
- ADX at 34.7 confirms sellers maintain directional control
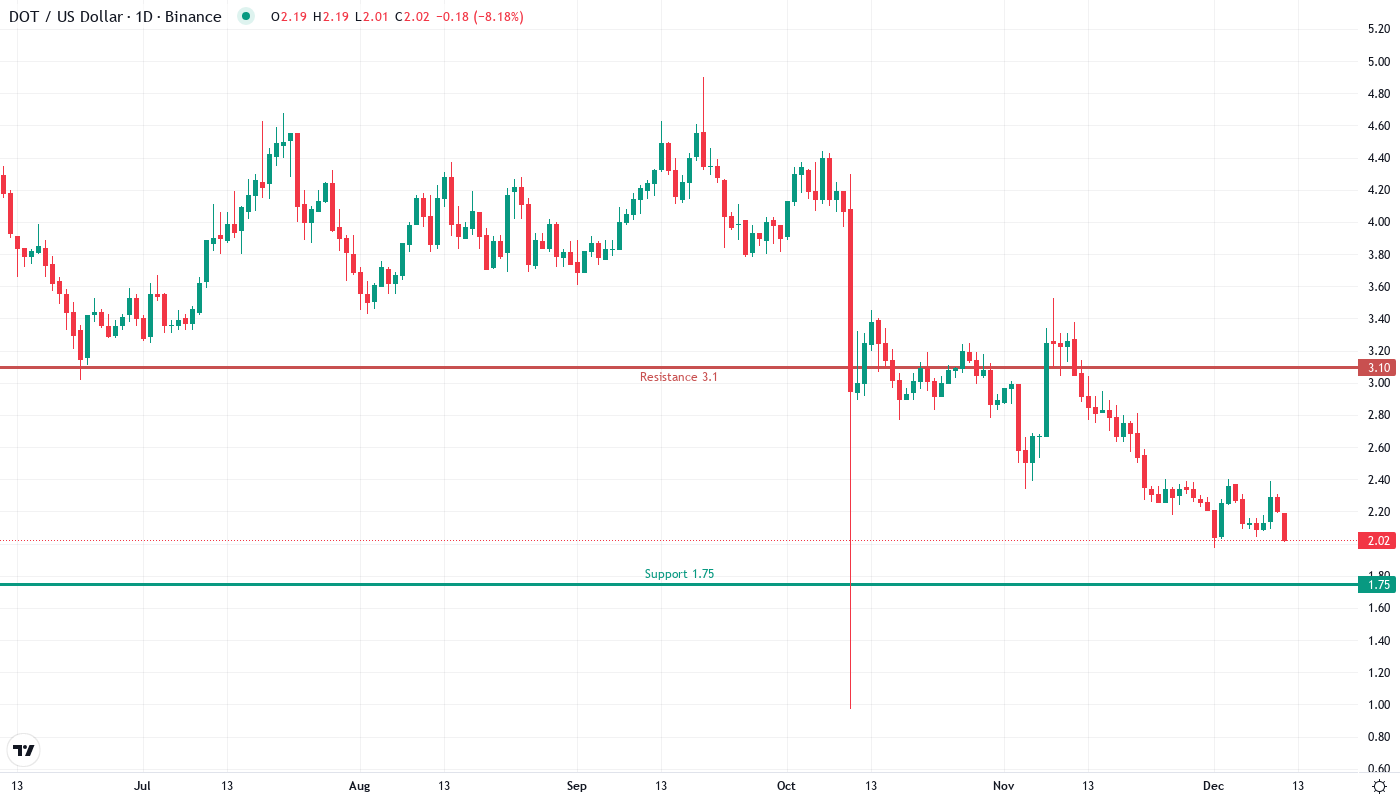
Polkadot’s inclusion in the Bitwise 10 Crypto Index Fund on NYSE Arca hasn’t prevented a devastating monthly collapse, with DOT shedding 37.9% to trade at $2.03 – its lowest level since the August 2024 washout. The coin’s addition to the first major ETF featuring next-generation protocols like Avalanche and Sui initially sparked optimism, but sellers overwhelmed any institutional demand, extending the decline to six straight monthly red candles. The main question for traders is: can the psychological $2 level hold, or will DOT follow through to fresh yearly lows despite the ETF tailwind?
| Metric | Value |
|---|---|
| Asset | POLKADOT (DOT) |
| Current Price | $2.03 |
| Weekly Performance | -14.35% |
| Monthly Performance | -37.92% |
| RSI (Relative Strength Index) | 36.7 |
| ADX (Average Directional Index) | 34.7 |
| MACD (MACD Level) | -0.15 |
| CCI (Commodity Channel Index, 20-period) | -136.29 |
RSI Plunges Below 37 – Oversold Territory Matches August Capitulation
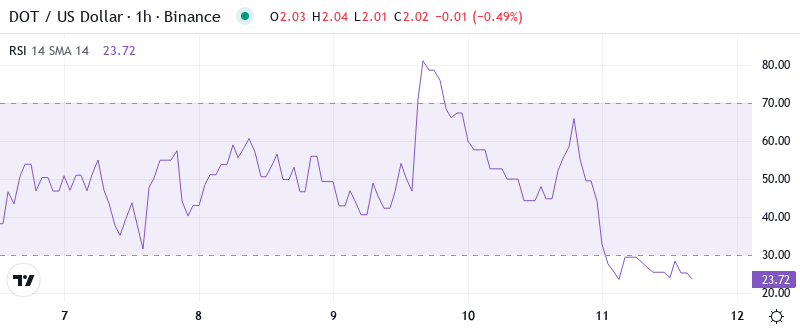
Reading the oscillator at 36.73 on the daily timeframe, traders see momentum conditions that haven’t appeared since August’s brutal selloff that marked the yearly low. This oversold reading typically signals either an imminent relief bounce or continued waterfall decline – and historically, DOT has bounced from sub-40 RSI levels roughly 70% of the time over the past two years.
What’s revealing is how RSI behaved during the ETF announcement – it barely budged above 40 despite the positive news, suggesting underlying weakness that smart money recognized early. So for swing traders, this deeply oversold condition creates a high-risk, high-reward setup where any bounce could be sharp but requires tight stops given the dominant downtrend.
ADX at 34.7 Confirms Mature Downtrend With Room to Run
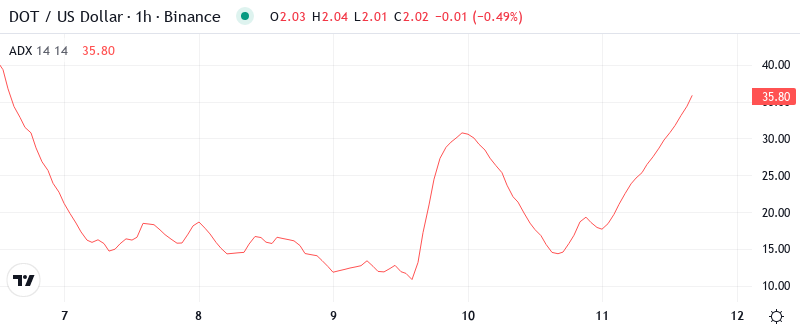
Trend strength readings paint a sobering picture for bulls hoping the ETF inclusion would reverse fortunes. At the level of 34.7, the ADX entry indicates that sellers have firm directional control, though we’re not yet at the extreme readings above 40 that typically mark trend exhaustion.
Basically, this ADX configuration tells day traders to stick with the trend – fade any bounces rather than trying to catch knives. The shift from November’s choppy, low-ADX conditions to December’s trending environment coincided precisely with the break below $3, suggesting institutional selling overwhelmed any ETF-related buying interest.
Price Trapped Below Entire EMA Ribbon Since $3 Breakdown
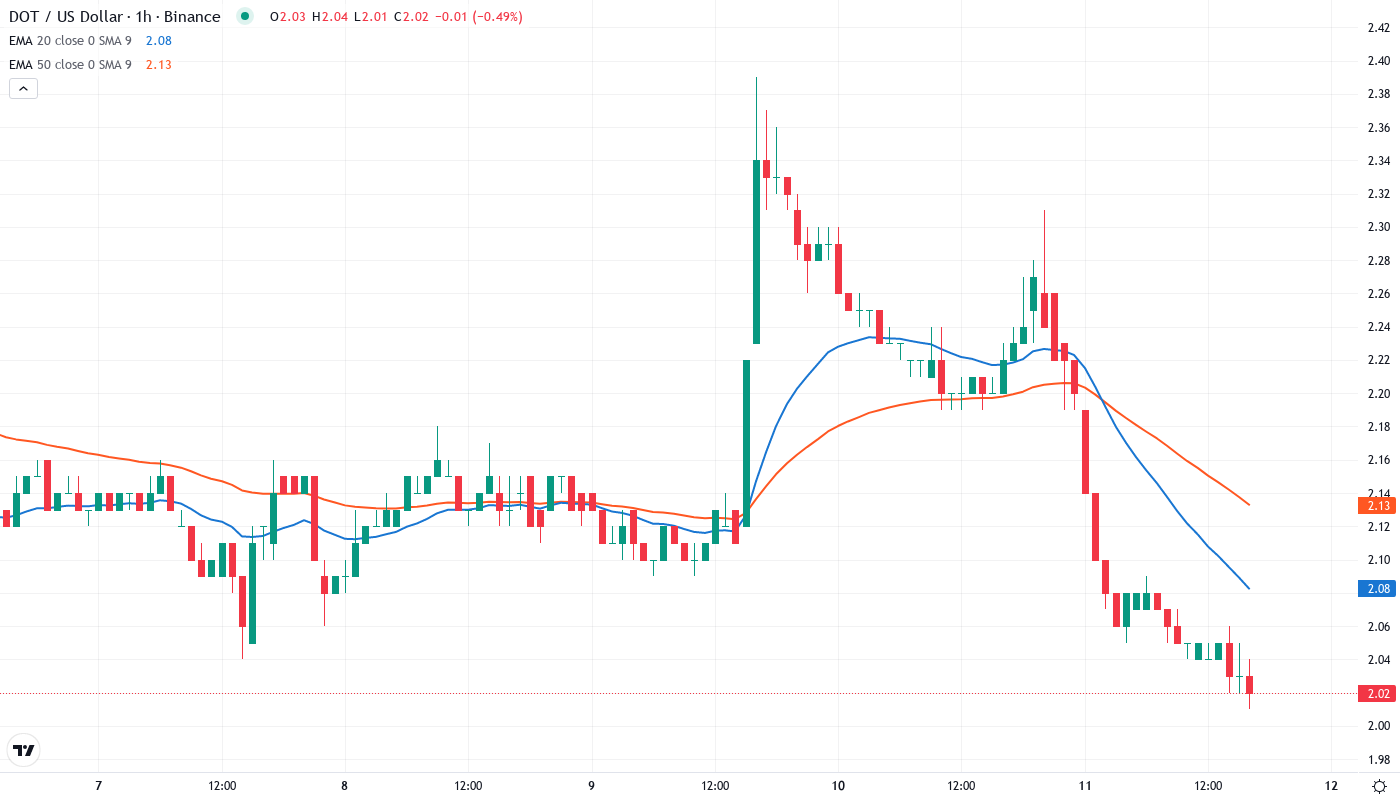
Moving average structure reveals the technical damage inflicted during December’s collapse. DOT currently trades below every major EMA – the 10-day ($2.18), 20-day ($2.28), 50-day ($2.61), and 200-day ($3.50) – creating a bearish stack that typically precedes further downside.
Most telling is the 50-day EMA’s trajectory, which rolled over aggressively after DOT failed to hold above $3 despite the ETF catalyst. This level that provided support throughout October and November has now flipped to resistance, and any relief rally will likely stall near $2.40-2.60 where the 20 and 50-day EMAs converge.
$2 Psychological Support Meets Yearly Lows as Last Defense
Below current price, buyers have precious little to work with. The immediate support sits at the psychological $2.00 level, which aligns closely with August’s $1.97 yearly low – creating a double-bottom potential that could attract some brave bottom-fishers.
Resistance stacks heavy overhead, with the first major hurdle at December’s breakdown point near $2.64, followed by the monthly pivot at $2.93. The November range between $3.10-3.40 now looks like distant memory, requiring a 50% rally just to retest.
Market structure clearly favors continued downside pressure as long as price remains below $2.40. The fact that positive ETF news couldn’t even generate a sustained bounce above the 20-day EMA speaks volumes about underlying weakness – this isn’t just crypto-wide selling, it’s DOT-specific liquidation.
Bears Target $1.75 as ETF Hype Fades Into Reality
Bulls need a daily close above $2.40 to even begin discussing trend reversal, and realistically would require reclaiming $2.64 to trap late shorts. The ETF inclusion provides a fundamental narrative for eventual recovery, but technical structure suggests more pain first.
Should DOT lose $2.00 support on volume, the next stop sits at $1.75 based on Fibonacci extensions and prior consolidation zones from early 2024. This would mark a full round-trip of 2024’s gains and likely trigger final capitulation from remaining holders.
Given the mature downtrend, deeply oversold conditions, and proximity to major support, the highest probability scenario sees DOT attempting a relief bounce toward $2.20-2.40 before sellers reassert control. Any sustained recovery requires both holding $2 and seeing genuine institutional flows from the ETF listing – neither of which looks imminent based on current price action.