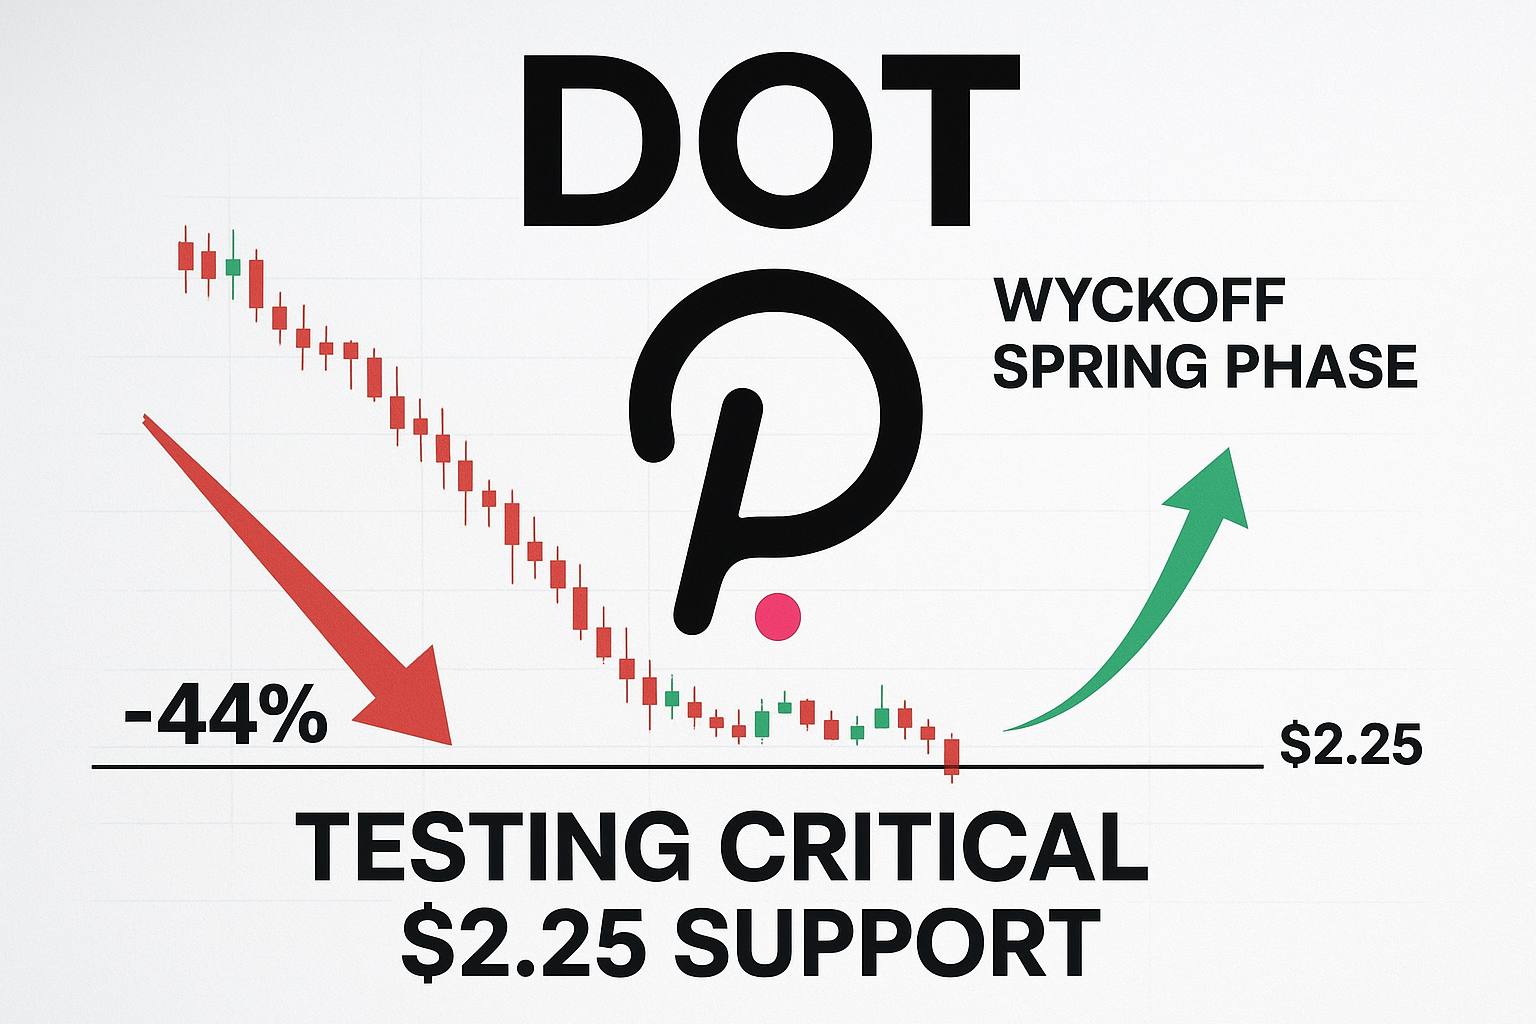
Polkadot Tests Critical $2.25 Support as Wyckoff Spring Completes Amid 44% Monthly Decline
Market Structure Shifts at Key Technical Junction
- DOT plunges 44% from monthly highs, landing precisely on multi-month support at $2.25
- Wyckoff Spring formation completes as governance strength builds – classic accumulation signal
- ADX climbs to 37.2, marking shift from consolidation to trending conditions
Polkadot’s savage descent from $3.53 to $2.25 represents a 44% monthly wipeout that has now landed the token squarely on make-or-break support. The devastating drop accelerated over the past week with a 10.4% slide, though interestingly, the decline has decelerated precisely as price hit the critical $2.25 zone where a textbook Wyckoff Spring pattern completed. The main question for traders is: will this multi-month support level that coincides with the Spring formation hold, or are we looking at another leg down toward the $1.96 monthly low?
| Metric | Value |
|---|---|
| Asset | POLKADOT (DOT) |
| Current Price | $2.25 |
| Weekly Performance | -3.85% |
| Monthly Performance | -10.36% |
| RSI (Relative Strength Index) | 39.8 |
| ADX (Average Directional Index) | 37.2 |
| MACD (MACD Level) | -0.17 |
| CCI (Commodity Channel Index, 20-period) | -50.59 |
Momentum Exhaustion Signals Capitulation Phase as RSI Hits 39.8
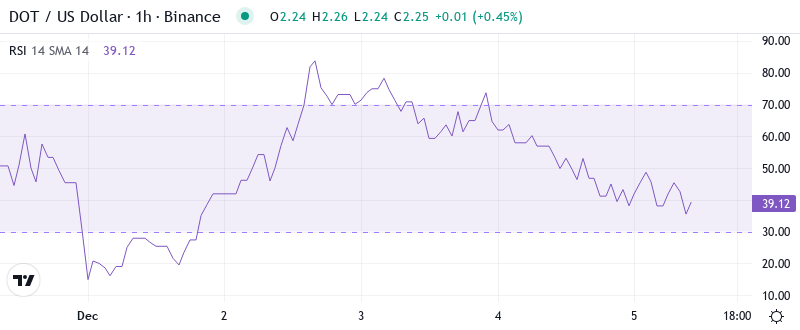
RSI sits at 39.82 on the daily timeframe, diving into oversold territory for the first time since the August washout that preceded a 35% relief rally. What’s particularly revealing is how the oscillator dropped from neutral readings above 50 just last week to current capitulation levels – a momentum collapse that mirrors the price action’s vertical nature.
The weekly RSI tells an even more dramatic story at 34.39, confirming that selling pressure has reached extreme levels across multiple timeframes.
Similar oversold configurations in September and November both marked significant bottoms for DOT, with the subsequent bounces averaging 25-30% gains before sellers returned. So for swing traders, this deeply oversold reading combined with the Wyckoff Spring completion at $2.25 suggests we’re entering the high-probability reversal zone, though catching this particular falling knife requires strict risk management given the ferocity of the current selloff.
ADX at 37.2 Confirms Mature Downtrend Nearing Exhaustion Point
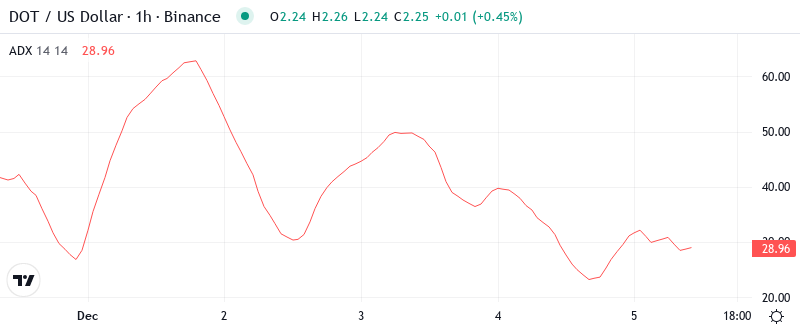
At the level of 37.23, the ADX entry indicates that the current downtrend has significant power behind it – we’re well past the choppy consolidation phase and deep into directional movement territory. Basically, when ADX readings climb above 35, it signals that the prevailing trend (in this case bearish) has reached a mature state where exhaustion becomes increasingly likely. The last time DOT’s ADX hit these levels was during the November flush that marked the previous cycle low.
To clarify, the ADX is indicating that we’ve transitioned from the grinding, sideways action of early December into a full-blown trending state – but at current extremes, this actually favors mean reversion traders over trend followers. Therefore, day traders should adjust their strategies accordingly, looking for reversal setups rather than continuation patterns, especially with price sitting on the Wyckoff Spring level that governance voters seem confident will hold based on recent referendum activity.
20-Day EMA at $2.40 Becomes First Resistance Target for Any Recovery
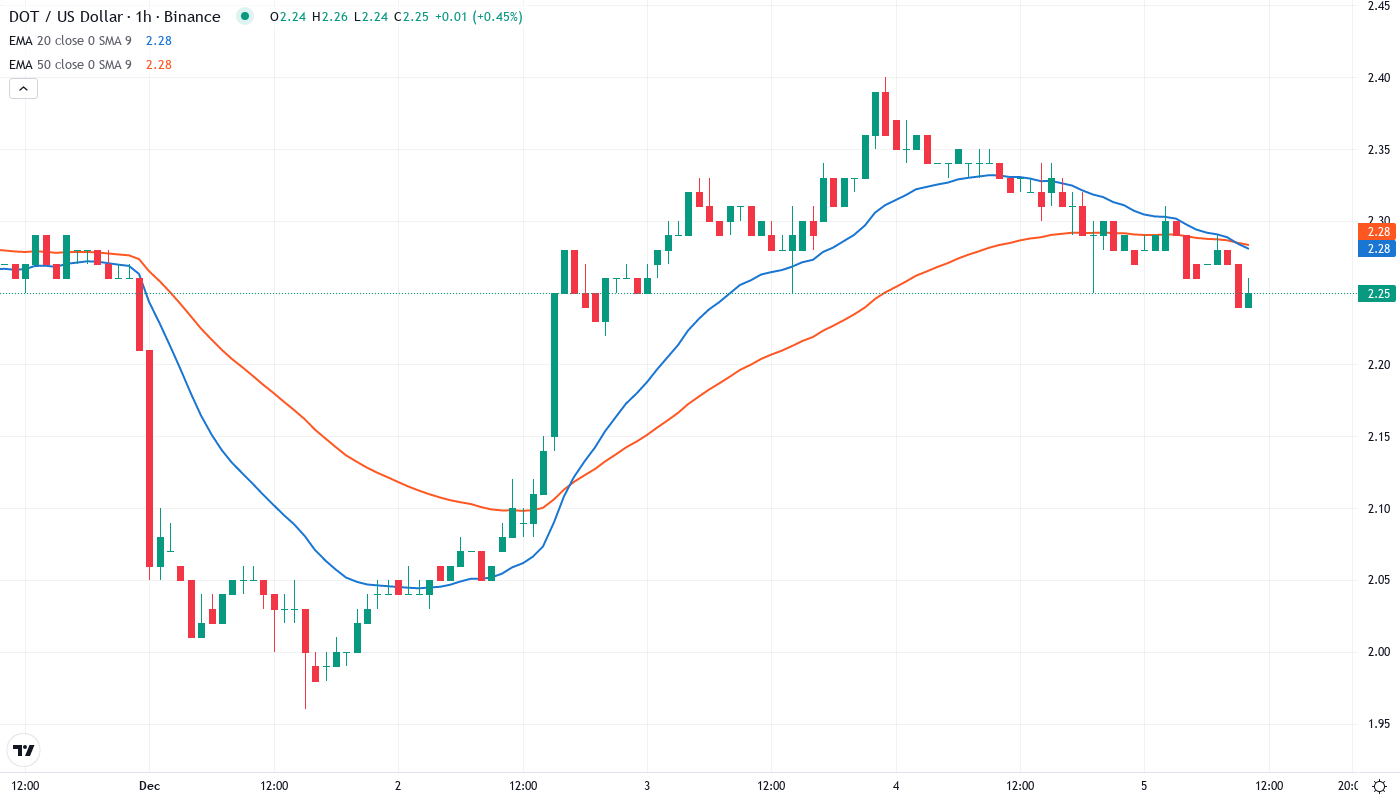
Price action through the EMA ribbons paints a decisively bearish picture – DOT currently trades below every single moving average from the 10-day ($2.29) all the way up to the 200-day (not visible on daily charts but sitting around $4.10). Most critically, the 20-day EMA at $2.40 has flipped from support to resistance after price crashed through it last week, while the 50-day EMA looms higher at $2.74 as a more substantial barrier. The compression between current price at $2.25 and the 10-day EMA at $2.29 suggests any bounce attempt will face immediate selling pressure.
What’s significant is how the 100-day EMA at $3.13 now sits a full 39% above current levels – a gap that hasn’t been seen since the 2022 bear market lows. This massive deviation from longer-term averages, combined with the successful test of the Wyckoff Spring level, creates conditions where mean reversion becomes increasingly probable. Enterprise demand shifting toward blockchain interoperability could provide the fundamental catalyst for such a reversion, given Polkadot’s core value proposition in that space.
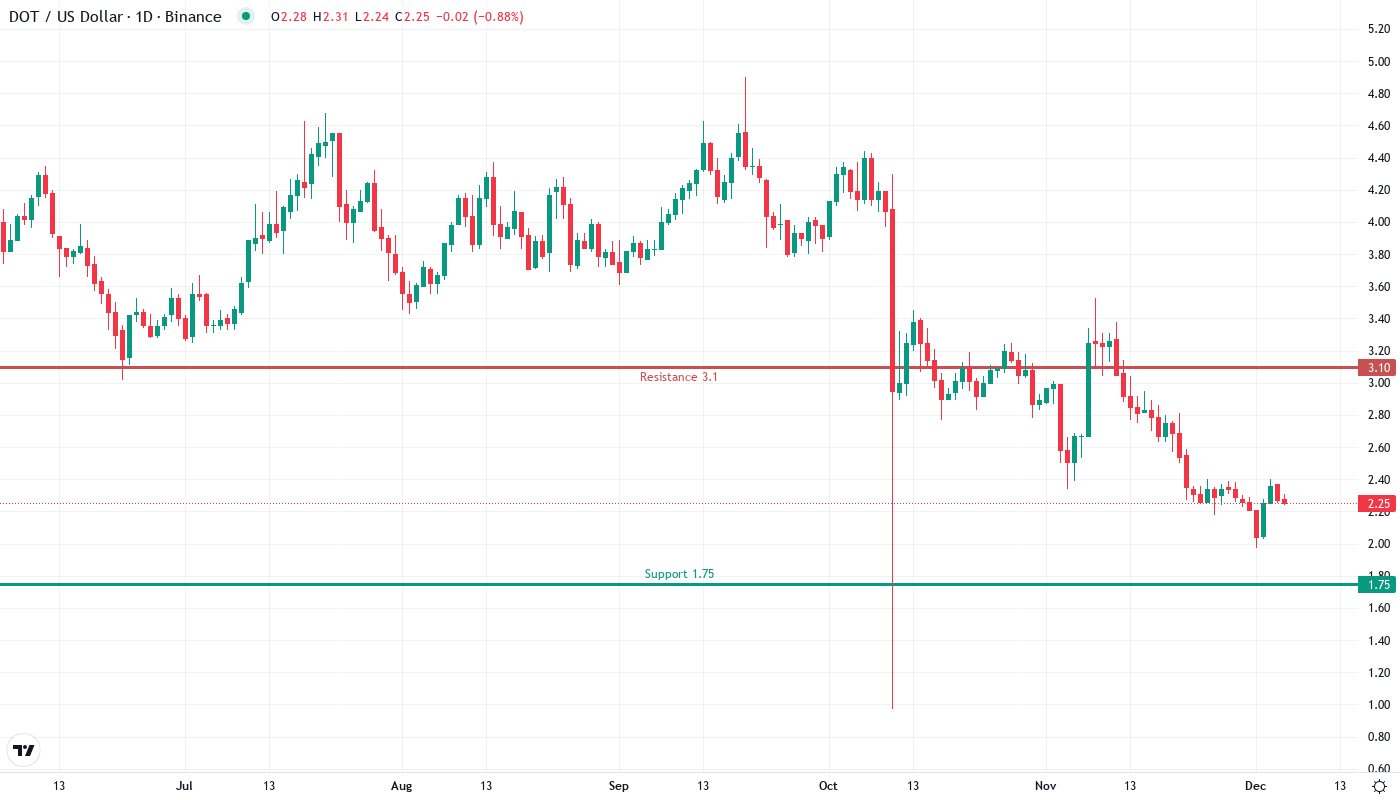
Support at $2.25 Holds After Six Touches While Resistance Stacks From $2.52 to $3.10
The immediate support structure has proven remarkably resilient with DOT bouncing from the $2.25 level six times since June – a level that gains additional significance from the completed Wyckoff Spring pattern. Below this crucial support, the next major floor sits at the monthly low of $1.96, though breaking the Spring level would likely trigger stops down to the psychological $2.00 mark first. The fact that high-weight governance voters backed recent referendums while price held this level suggests institutional confidence in this support zone.
Resistance stacks up in clearly defined layers starting with the monthly pivot at $2.64, followed by the psychologically important $3.00 level that aligns with December’s breakdown point. Above that, the monthly R1 at $3.10 converges with the 100-day EMA to create a formidable barrier that would likely cap any relief rally attempts. The weekly pivot levels tell a similar story with R1 at $3.99 sitting nearly 80% above current prices – a reminder of how far DOT has fallen.
Market structure reveals a classic accumulation setup as long as bulls can defend $2.25 on any retests. The convergence of the Wyckoff Spring completion, extreme oversold readings, and six successful defenses of this level creates a compelling risk-reward scenario for bottom fishers. However, the sheer distance to overhead resistance means any recovery will likely unfold in stages rather than a straight shot higher.
Bulls Require Convincing Close Above $2.40 to Confirm Spring Validity
Bulls must secure a daily close above the 20-day EMA at $2.40 to confirm the Wyckoff Spring is valid and shift near-term momentum. Such a move would target the $2.64 monthly pivot next, with the broader enterprise adoption narrative potentially providing fundamental support as the Bitwise ETF approval brings fresh institutional attention to interoperable blockchain solutions. The governance strength shown during this selloff suggests community conviction remains intact despite price weakness.
The bearish scenario triggers if $2.25 support fails on volume – this would invalidate the Spring pattern and likely flush positions down to $1.96 or even the psychological $1.75 level.
A breakdown here would trap recent buyers who entered on the Wyckoff setup and could cascade into capitulation selling as the 44% monthly loss extends further. Weekly closes below $2.25 would be particularly damaging to the technical structure.
Given the extreme oversold conditions, successful Spring formation at multi-month support, and ADX readings suggesting trend exhaustion, the highest probability near-term path is a relief bounce toward the $2.40-$2.64 resistance zone before sellers regroup. The key will be whether this bounce shows genuine accumulation volume or merely represents short covering into year-end position squaring.