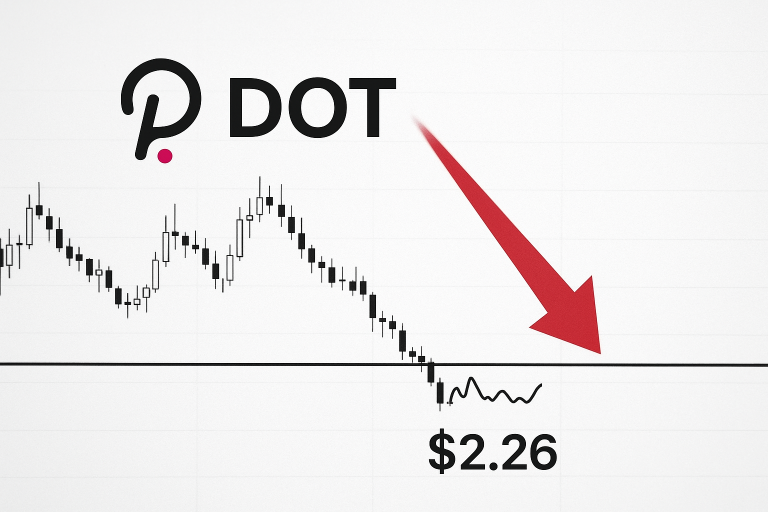
Polkadot Tests Critical $2.00 Support as ETF Inclusion Meets Bearish Momentum

Market Structure Shifts Lower
- DOT trades at $2.07, unchanged over the past week despite Bitwise ETF inclusion
- Technical indicators flash mixed signals with RSI near oversold territory at 39.62
- Critical psychological support at $2.00 faces sixth test since June
Polkadot’s price action tells a sobering story this week, with DOT clinging to $2.07 despite the Bitwise ETF debut that should have provided tailwind. The cryptocurrency has shed 36.7% over the past month and sits down 51.2% from three months ago, making it one of the weaker performers in the large-cap space. What’s particularly concerning is how the ETF inclusion news failed to spark any meaningful bounce – a classic case of “buy the rumor, sell the news” playing out in real-time. The main question for traders is: can the $2.00 psychological level hold after being tested repeatedly, or are we looking at a breakdown toward $1.75?
| Metric | Value |
|---|---|
| Asset | POLKADOT (DOT) |
| Current Price | $2.07 |
| Weekly Performance | -12.66% |
| Monthly Performance | -36.70% |
| RSI (Relative Strength Index) | 37.9 |
| ADX (Average Directional Index) | 34.5 |
| MACD (MACD Level) | -0.15 |
| CCI (Commodity Channel Index, 20-period) | -116.70 |
RSI Approaches Oversold Zone After Five-Month Grind Lower
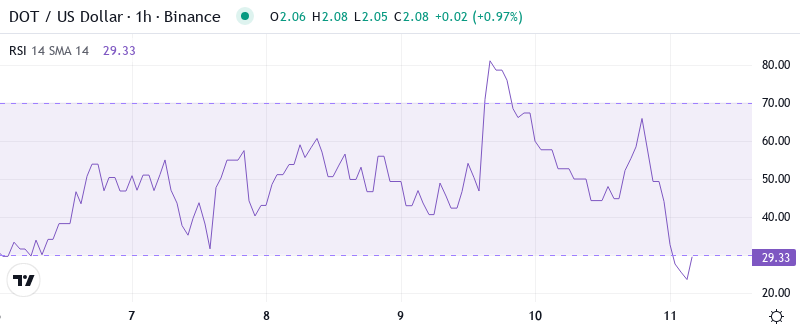
Reading the oscillator at 39.62 on the daily timeframe, traders see momentum exhaustion approaching but not quite at capitulation levels. This marks the lowest RSI reading since the August washout when DOT briefly touched $3.50 before staging a relief rally. The weekly RSI paints an even more concerning picture at 32.70, suggesting the longer timeframe remains far from exhausted on the downside.
What’s revealing is how RSI behaved during the ETF announcement – barely a blip above 40 before rolling over again. Similar momentum failures in September and November preceded legs down of 25% or more. So for swing traders, this tepid RSI response despite positive fundamental news signals that sellers remain firmly in control, and any bounces should be viewed skeptically until RSI can reclaim and hold above 50.
ADX at 34.53 Confirms Sellers Drive This Trending Move

Trend strength reads decisively bearish with ADX climbing to 34.53, its highest level since the May capitulation. Basically, being in this zone above 30 tells us that the current downtrend has conviction behind it – this isn’t just choppy price action but directional selling pressure. The ADX reading confirms what price action suggests: bears have taken control and aren’t letting go easily.
During the past week, ADX actually increased from 31 to current levels despite the ETF catalyst, indicating that the selling intensified rather than abated. To clarify, the ADX is indicating that we’re firmly in trending conditions where countertrend trades carry higher risk. Therefore, day traders should adapt their strategies to favor shorts on rallies rather than trying to catch falling knives, at least until ADX drops back below 25 to signal trend exhaustion.
20-Day EMA at $2.28 Caps Rally Attempts as Bears Defend Higher
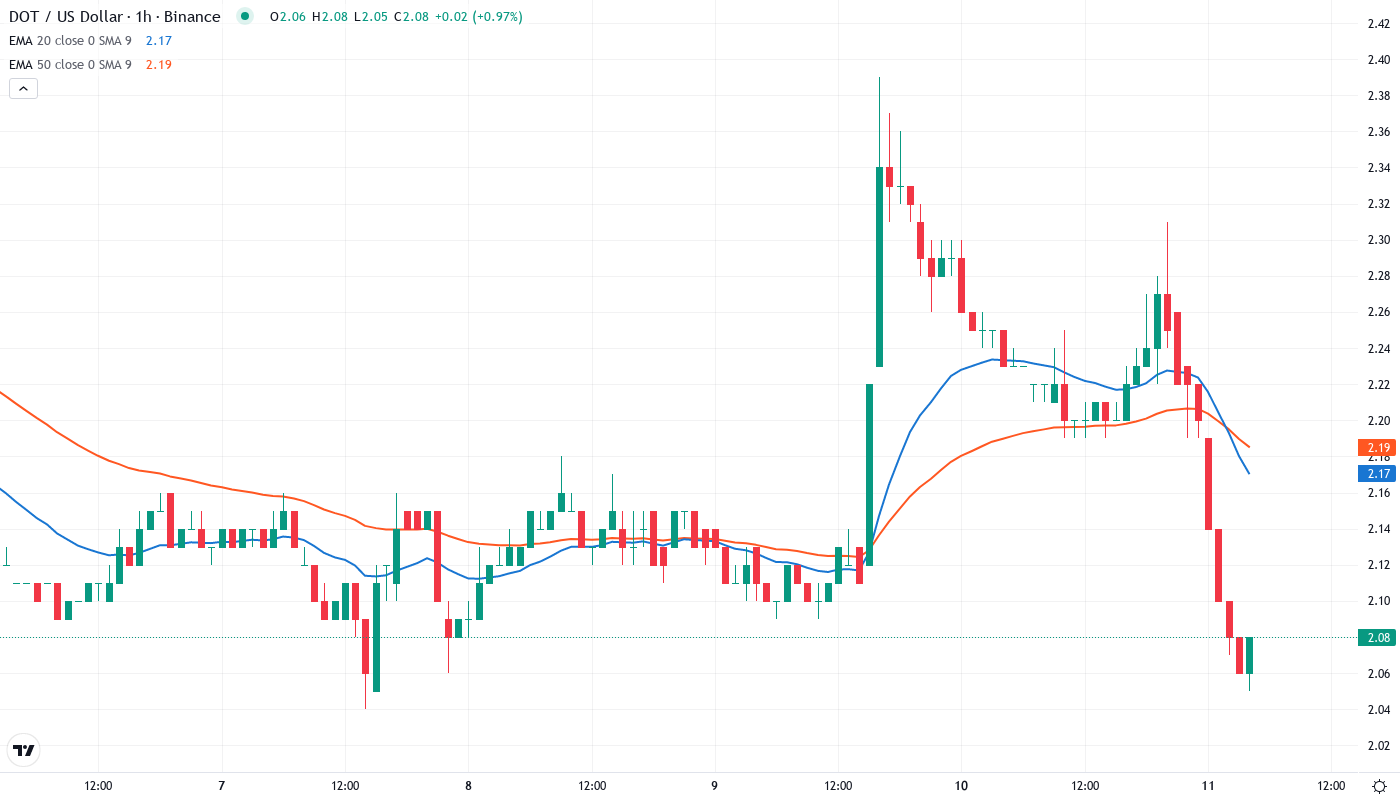
Price action through the EMA ribbons reveals a textbook bearish structure. DOT currently trades below all major moving averages, with the 10-day EMA at $2.19 providing immediate resistance, followed by the 20-day at $2.28. More concerning is how the 50-day EMA at $2.61 has rolled over sharply, confirming the intermediate trend has turned decisively negative. Even the long-term 200-day EMA sits far overhead at $3.50, roughly 69% above current levels.
The compression between the 10-day and 20-day EMAs hints at a potential squeeze, but with price below both, the path of least resistance remains lower. That former support area around the 50-day EMA at $2.61 now transforms into formidable resistance that would require significant buying pressure to reclaim. It is worth mentioning that the ETF inclusion couldn’t even push price to test the 10-day EMA – a sign of how weak the underlying bid remains.
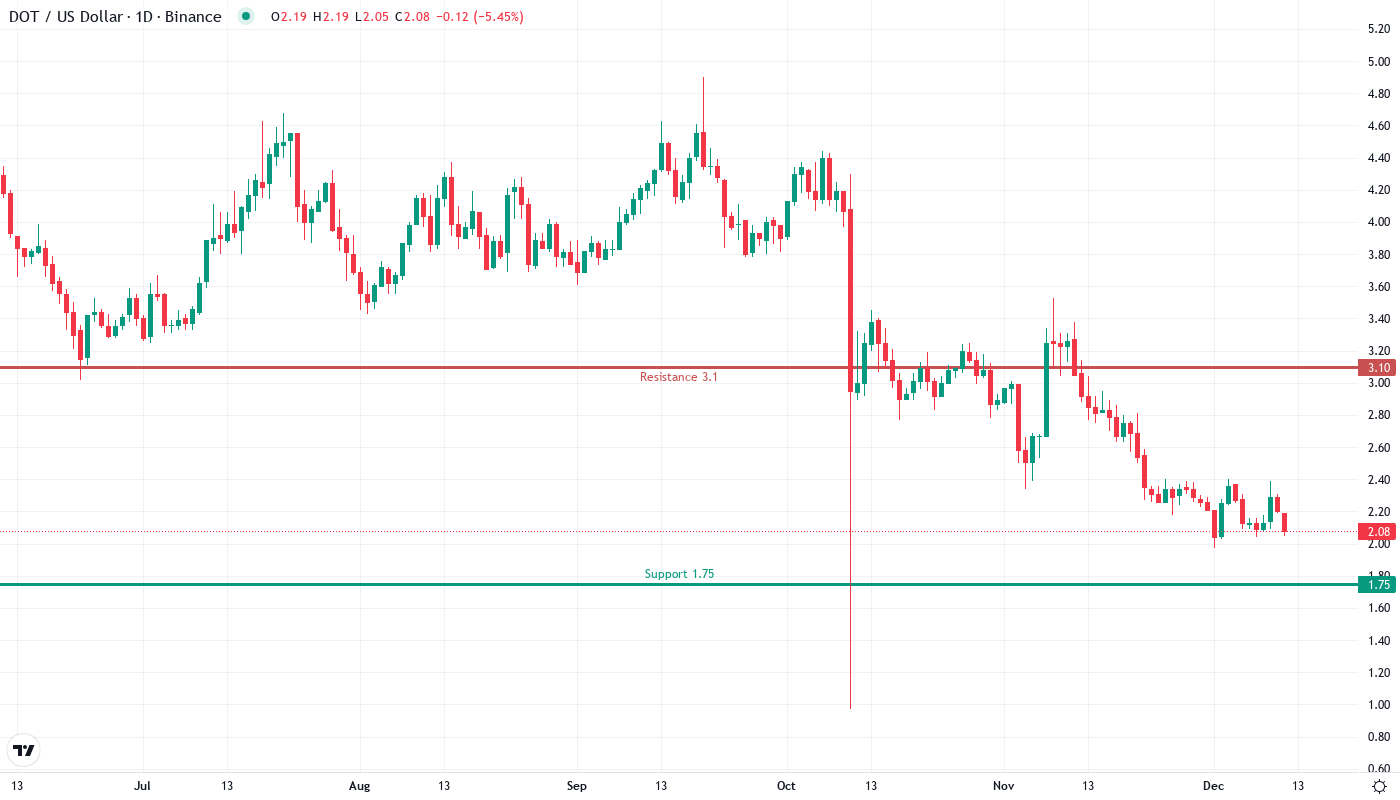
$2.00 Psychological Support Faces Make-or-Break Moment
Above current price, sellers have stacked multiple resistance layers between $2.28 and $2.61, encompassing the entire short-term EMA complex. The monthly pivot at $2.64 adds another barrier, while December’s highs near $3.14 feel like distant memory. Each rally attempt faces increasingly heavy supply, with the most recent rejection coming at just $2.19 despite the ETF tailwind.
Bulls defend their final stronghold at the psychological $2.00 level, which has provided bounces six times since June. Below that, the next meaningful support doesn’t emerge until $1.75, representing another 15% downside. The weekly chart shows this $2.00 level aligning with the 2023 lows, making it absolutely critical for any bullish thesis to remain intact.
This configuration resembles a descending triangle pattern, with horizontal support at $2.00 meeting a down-sloping resistance line. Typically, such patterns resolve in the direction of the prevailing trend – which currently favors the bears. The lack of volume on the recent ETF-driven bounce attempts suggests accumulation remains absent.
Bulls Need Miraculous Close Above $2.28 to Shift Momentum
Should price somehow reclaim the 20-day EMA at $2.28 with conviction, it would mark the first positive technical development in weeks. Bulls require not just a spike above but a daily close with volume to confirm any potential reversal. Even then, the 50-day EMA at $2.61 looms as the next major hurdle where sellers are likely to emerge aggressively.
The bearish scenario triggers if $2.00 support fails on a closing basis. Loss of this psychologically important level would likely cascade into stop-losses and forced liquidations, targeting $1.75 initially and potentially $1.50 if selling accelerates. The fact that positive ETF news couldn’t generate any sustainable buying interest suggests the path of least resistance remains lower.
Given the technical configuration and momentum dynamics, the most probable near-term outcome sees DOT grinding between $1.95 and $2.15 before ultimately resolving lower. Without a significant fundamental catalyst beyond the already-digested ETF news, bears maintain control of this market with each bounce providing better short entries rather than accumulation opportunities.