Pi Network Plunges 43% as Mainnet Launch Approaches – Support at $0.19 Faces Critical Test

Market Structure Shifts Lower
- Pi Network shed 43% in the past month despite approaching mainnet launch and DEX preparations
- RSI at 44.34 signals momentum reset after reaching overbought extremes above 70
- Support at $0.193 tested multiple times as bulls defend December lows
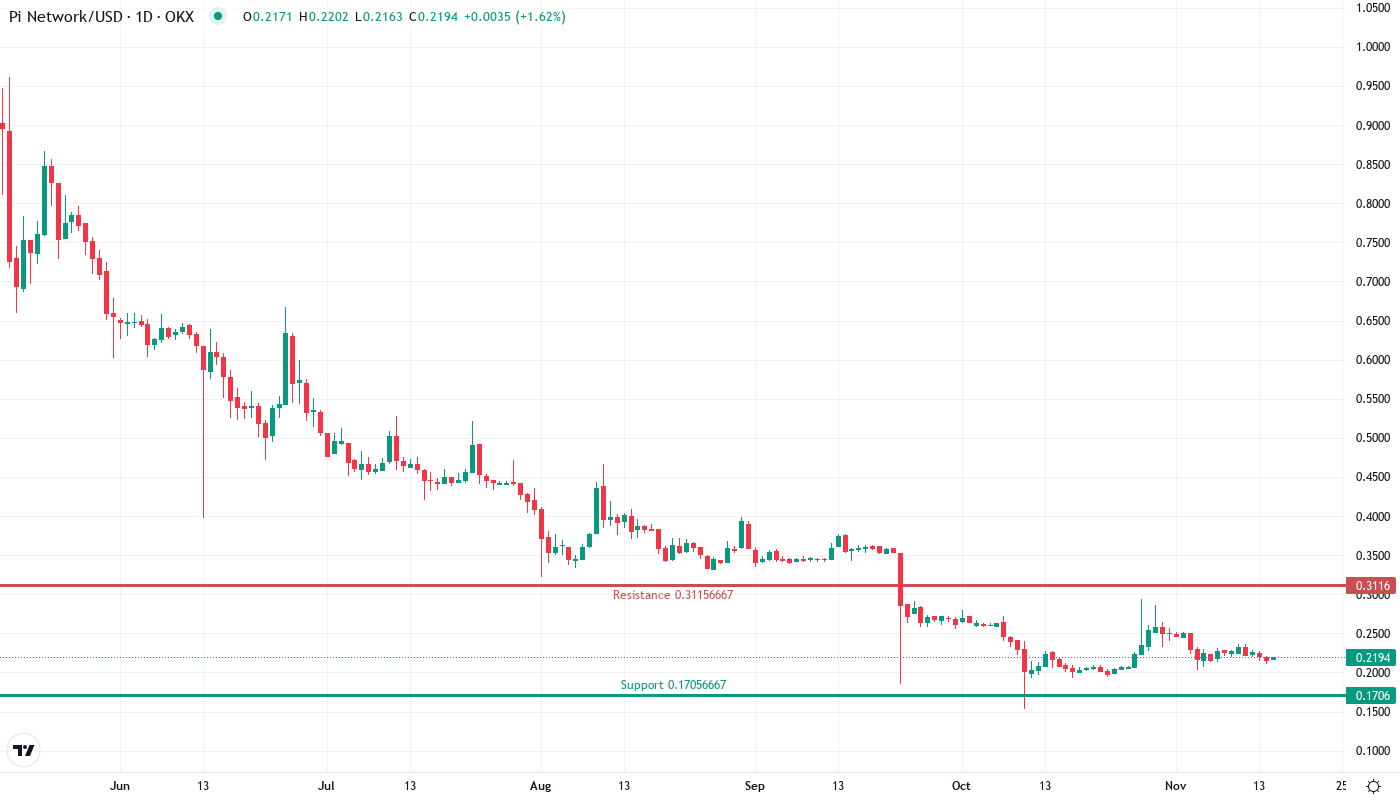
Pi Network’s devastating drop from $0.2939 to $0.2186 marks a 43% monthly collapse, erasing gains accumulated since the summer despite significant ecosystem developments including mainnet preparations and upcoming DEX launch. The token’s monthly performance stands as one of the worst in the crypto market, with the 3-month and 6-month returns painting an even grimmer picture at -71% and -69% respectively. The main question for traders is: can the $0.19 support zone hold through the token unlock event, or will increased supply pressure push Pi toward new lows?
| Metric | Value |
|---|---|
| Asset | PI (PI) |
| Current Price | $0.22 |
| Weekly Performance | -4.21% |
| Monthly Performance | 4.64% |
| RSI (Relative Strength Index) | 44.0 |
| ADX (Average Directional Index) | 21.9 |
| MACD (MACD Level) | 0.00 |
| CCI (Commodity Channel Index, 20-period) | -76.12 |
Momentum Resets to 44.34 After Reaching Overbought Territory
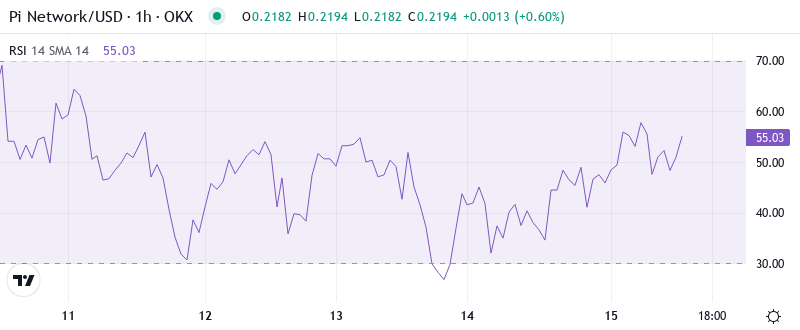
RSI sits at 44.34 on the daily timeframe, indicating momentum has cooled significantly from recent peaks without yet signaling capitulation. The oscillator’s journey from overbought readings above 70 down to current neutral territory mirrors the price action’s brutal correction, with sellers maintaining control throughout December despite the positive news flow around mainnet preparations. What’s revealing is how RSI behaved during the node version 0.5.4 upgrade announcement – the enhanced mining rewards failed to spark any meaningful momentum shift, suggesting technical damage runs deeper than news catalysts can immediately repair.
So for swing traders, this balanced RSI means the immediate selling pressure has eased, but conviction remains absent. Historical patterns show Pi tends to bottom when RSI dips below 35, meaning there’s potentially more downside before a genuine reversal setup emerges. The upcoming token unlock adds another layer of complexity – if RSI fails to hold above 40 during that event, it would signal fresh selling waves ahead.
ADX at 21.85 Signals Weak Trend After December Collapse
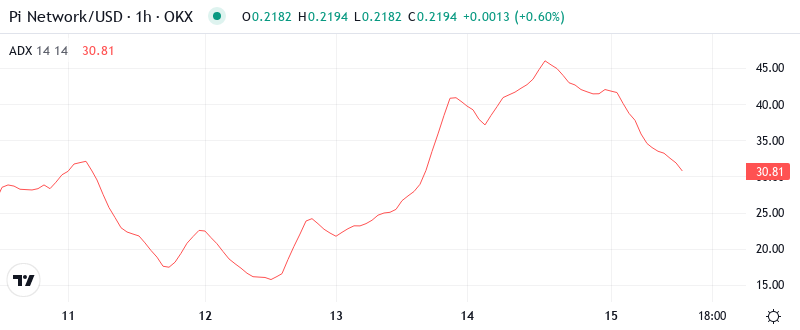
Looking at trend strength, the ADX reads 21.85, marking a significant decline from higher readings during the trending move down. This suggests the initial panic selling has subsided into a more subdued drift lower. Basically, being in this zone indicates the market has shifted from decisive trending conditions back toward range-bound behavior, which typically emerges after sharp corrections exhaust themselves.
To clarify, the ADX is indicating that we are transitioning from strong directional movement to a potential accumulation or distribution phase. The mainnet launch timeline and DEX preparations create an interesting dynamic here – typically such fundamental catalysts would drive trending behavior, but the market appears to be waiting for clarity on token unlock impacts first. Therefore, range traders might find better opportunities than trend followers until ADX climbs back above 25.
Price Trapped Below Entire EMA Ribbon Since Mid-December
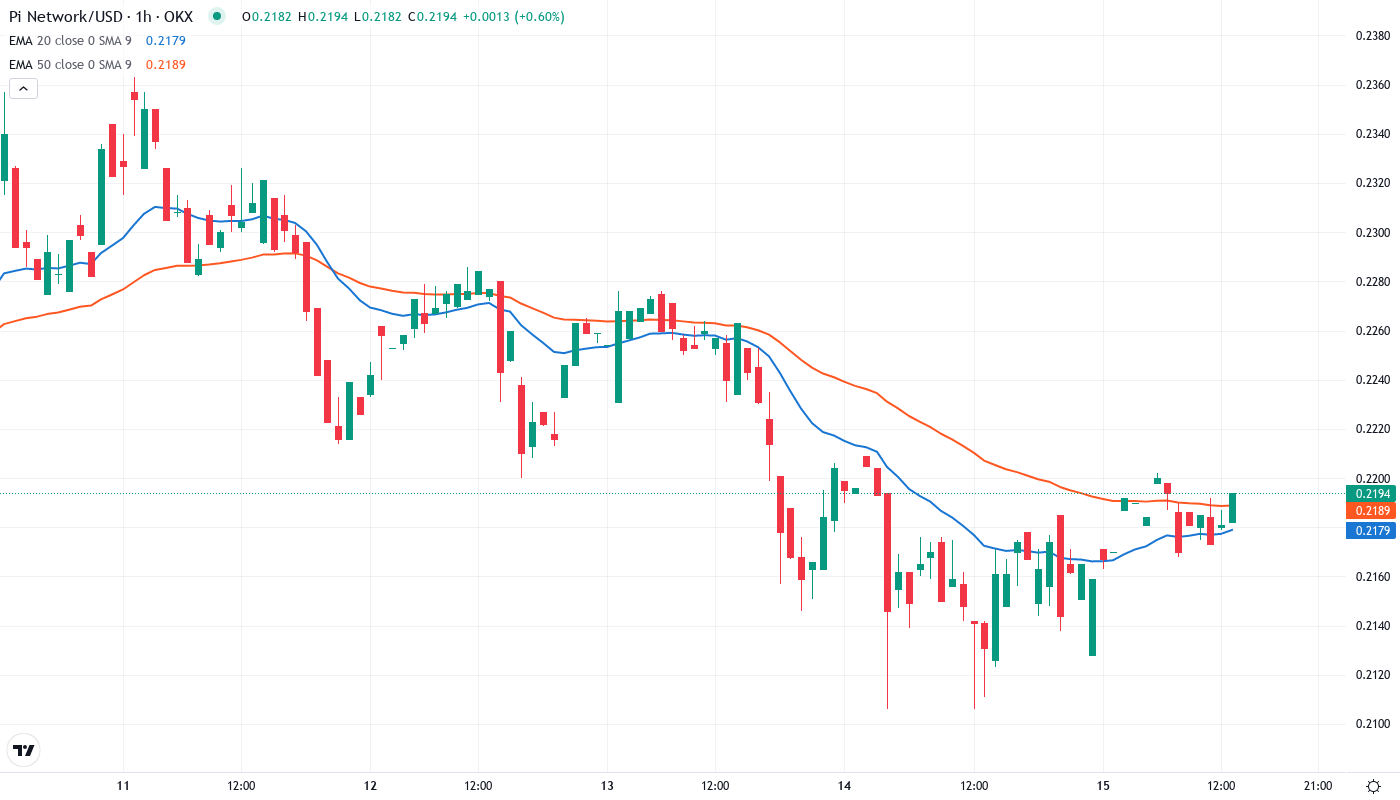
Price action tells a clear story through the EMA structure. PI trades well below the 10-day ($0.2233), 20-day ($0.2261), and crucially, the 50-day EMA at $0.2449. The compression between these moving averages suggests sellers defended each level during attempted bounces, with the 50-day EMA now acting as formidable resistance nearly 12% above current prices. Even more concerning, the 100-day EMA sits at $0.3068 and the 200-day at $0.4878 – both seeming like distant memories from the current $0.2186 level.
What’s significant is how the 20-day EMA flipped from support to resistance right as the token unlock news hit the wires. That former support area around $0.226 now transforms into a critical level bulls must reclaim to shift near-term sentiment. The fact that price couldn’t hold above even the fastest moving averages during positive development announcements (node upgrades, DEX preparations) underscores the technical damage inflicted by the 43% monthly drop.
Support at $0.193 Holds as Bulls Make Stand at December Lows
Resistance stacks heavy between current levels and any meaningful recovery targets. The immediate resistance zone spans from $0.2233 (10-day EMA) up through $0.2322 where the monthly pivot middle sits. Beyond that, sellers have fortified positions at $0.2449 (50-day EMA) and the psychological round number at $0.25. Any attempt to recover December’s losses faces multiple barriers, with the monthly R1 at $0.3116 appearing particularly distant given current momentum conditions.
Bulls defend multiple support layers below, though each test weakens the foundation. The December low at $0.193 has attracted buyers three times, but the upcoming token unlock event will likely test this level’s durability. Below that, the monthly S1 at $0.1706 offers the next technical support, though a break there would open air pockets toward $0.15 psychological support. The monthly S2 at $0.0912 seems extreme but represents where longer-term buyers might emerge if the mainnet launch disappoints.
This configuration resembles a descending triangle pattern, with $0.193 as the horizontal support and declining peaks forming the upper trendline. Typically such patterns resolve to the downside, especially when fundamental events like token unlocks increase supply. However, the simultaneous mainnet launch and DEX deployment could provide the catalyst for an upside surprise if execution impresses the market.
Bulls Need Decisive Reclaim of $0.226 to Shift Momentum
Should price reclaim the 20-day EMA at $0.2261 on strong volume, it would signal the first real shift in market structure since December’s collapse began. Bulls require a daily close above this level to confirm buyers have returned, with the next target at $0.245 (50-day EMA) if momentum builds. The combination of mainnet launch and DEX functionality could provide the fundamental backdrop for such a recovery, but technical repair takes time after a 43% monthly decline.
The setup fails if December lows at $0.193 break during the token unlock event. This would trap recent bottom-fishing attempts and likely trigger stops toward $0.1706 (monthly S1), with the psychological $0.15 level as the next major support below that. Given that mining reward improvements from version 0.5.4 couldn’t prevent the current slide, a break of $0.193 would suggest fundamental concerns outweigh positive developments.
Given the technical damage, upcoming token unlocks, and current position below all major EMAs, the most probable near-term path involves continued consolidation between $0.193 and $0.226. The mainnet launch provides a binary catalyst that could break this range in either direction, but until then, the market appears content to wait in this compressed zone while digesting December’s dramatic repricing.