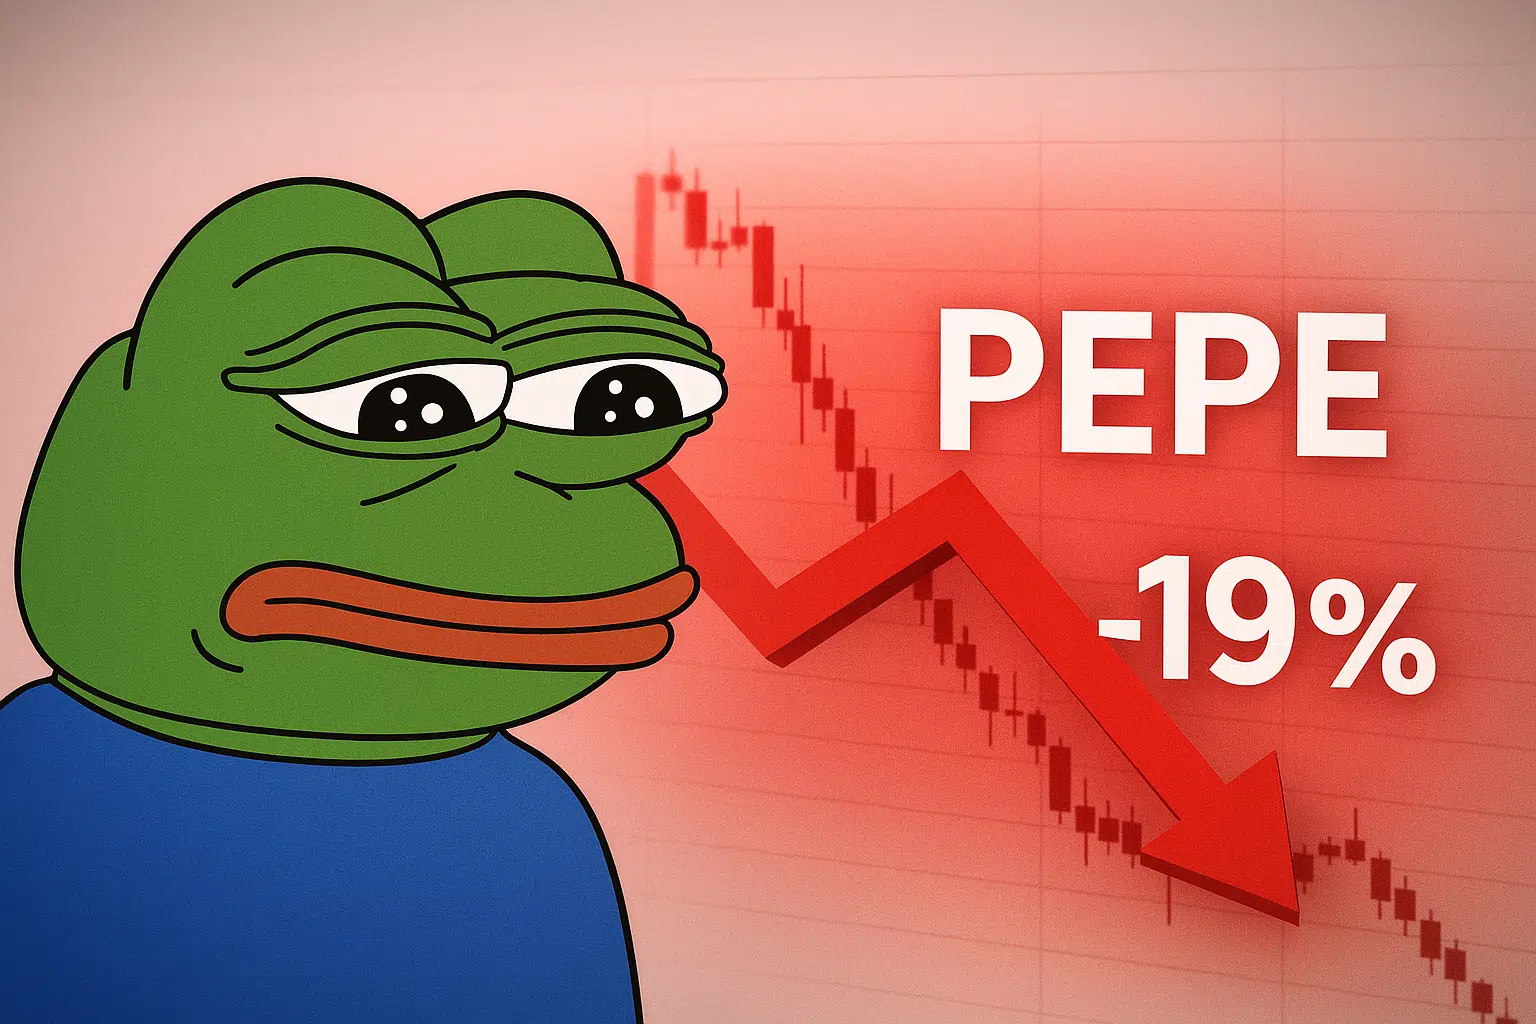
PEPE Plunges 19% as Website Hack Compounds Memecoin Sector Collapse
Market Structure Shifts Lower
- PEPE retraced by nearly 19%, as overall sentiment in the meme sector weakened.
- Losses partly due to a recent hacking, though PEPE has climbed over 30% off local lows.
- Technicals support the downside: RSI at 37.32 and ADX above 30.
PEPE/USD kicked off this week with a 4.57% pullback on the day, dropping below the pre-week averages.
PEPE’s brutal drop intensified after cyber attackers breached the website, exposing users to some well-crafted contract drainers, and further undermined the already extremely fragile faith among investors. The memecoin declined 19% during the last week and is 63% behind its quarterly top, while the breach added to a particularly harsh decline in the sector.
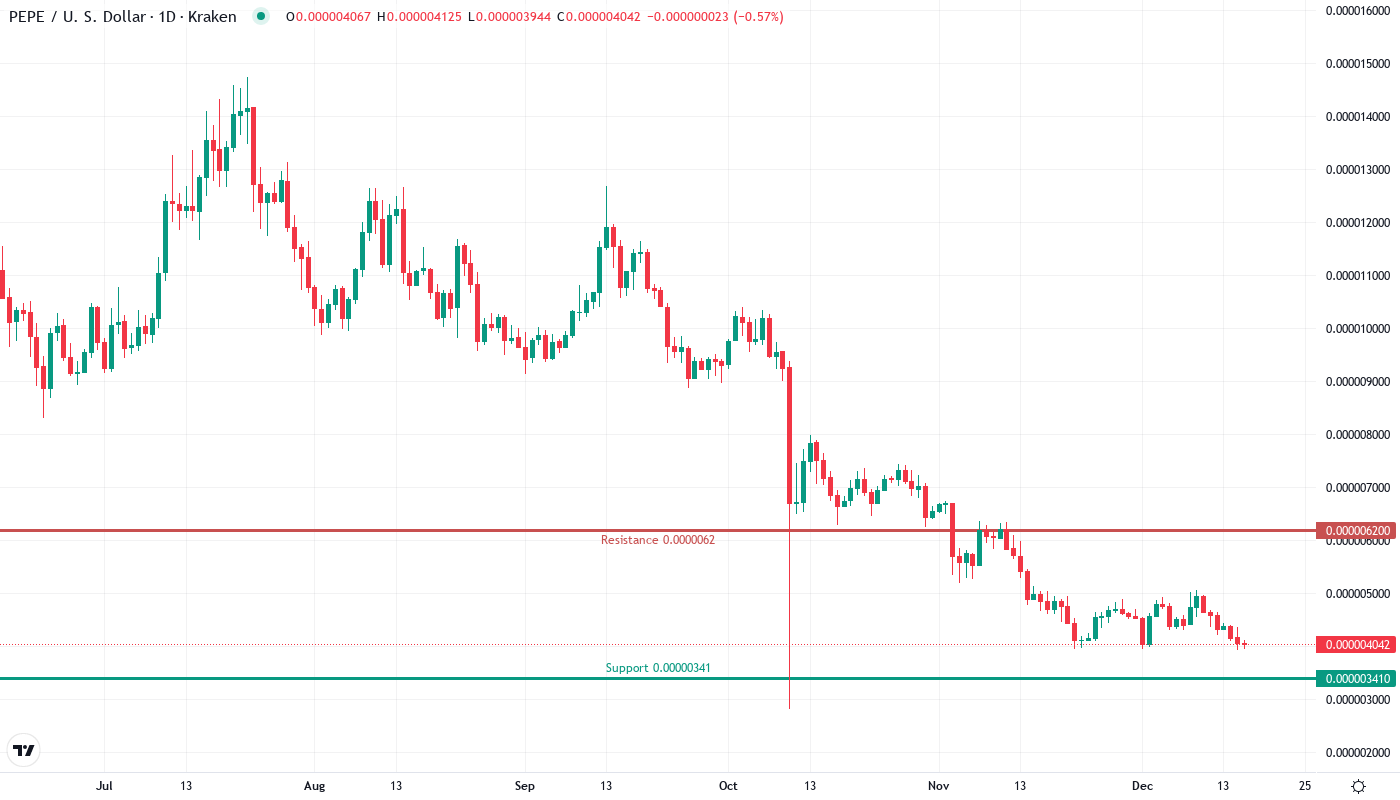
The most significant remaining question for traders is whether the critical support of $0.0000039 can be maintained after six consecutive daily red candles, or whether panic selling will trigger a slide to $0.0000032.
| Metric | Value |
|---|---|
| Asset | PEPE (PEPE) |
| Current Price | $0.00 |
| Weekly Performance | -14.82% |
| Monthly Performance | -18.82% |
| RSI (Relative Strength Index) | 37.3 |
| ADX (Average Directional Index) | 30.5 |
| MACD (MACD Level) | 0.00 |
| CCI (Commodity Channel Index, 20-period) | -163.32 |
Momentum Exhaustion Signals Capitulation Phase as RSI Hits 37.32
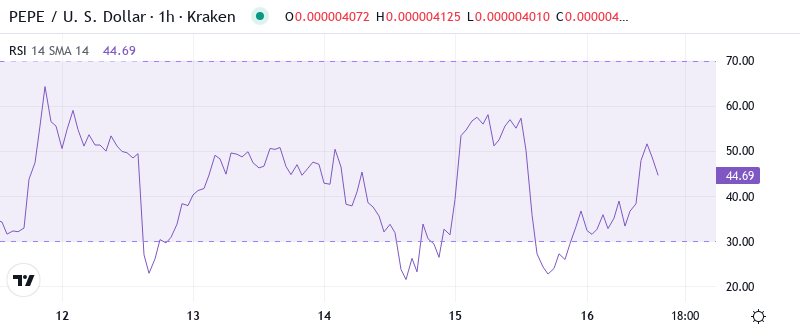
The Relative Strength Index is currently at 37.32 on the daily timeframe, hitting the closest point to oversold conditions since the August panic dump immediately preceding the 180% uptrend. This was one of the fastest momentum meltdowns following a hike to 72 in more than a year of PEPE The Frog’s highly volatile price action.
One of the most obvious signals of a euphoria-fueled top is how RSI barely moved following yesterday’s minor bounce higher – an unmistakeable sign that sellers are dominating the market.
The oversold bounces after similar RSI readings in September and November were sizable, but oversold RSI2 conditions alone aren’t enough for swing traders to simply buy and hold. A different risk profile, where holders are eager to sell, exists this time.
ADX at 30.54 Confirms Sellers Drive Strong Directional Move
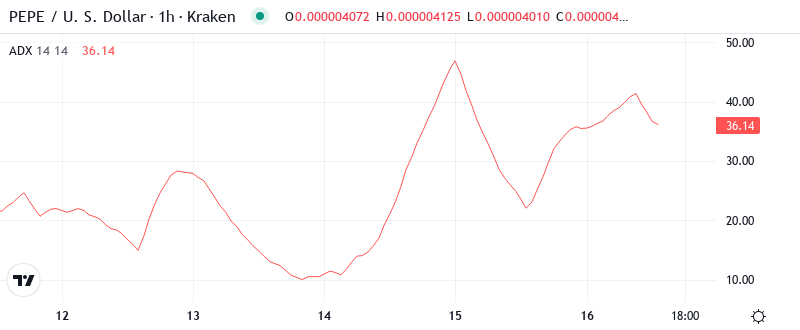
When we assess trend strength, the ADX reading of 30.54 indicates that we have moved firmly out of the two-week consolidation phase and into a true trending phase to the downside. The ADX has increased from 18 just five days ago, showing that news of the website exploit sparked a more significant decline.
With the ADX at 30.54, the trend is strong but not yet overbought (above 40). Trend following remains viable until the ADX exceeds 40, and day traders may reduce long positions until the 15-minute ADX falls below 25.
Daily EMAs Stack as Resistance After Support Structure Collapses
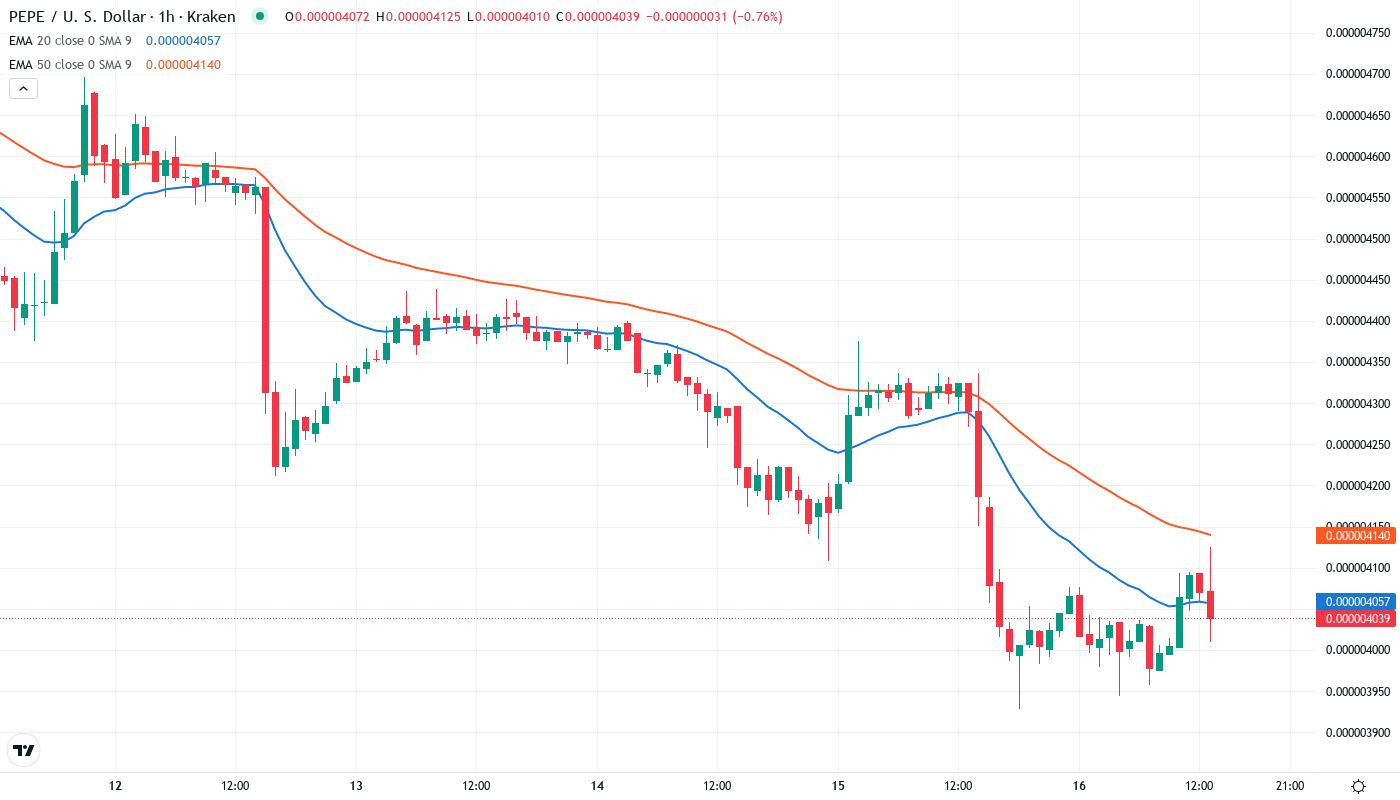
The last time PEPE traded above its 50-day EMA was in mid-November. The 100-day EMA, at $0.00000509, has acted as a reliable inflection point since July, and the recent death cross between the 50 and 100 EMAs makes reclaiming this zone more arduous. Stringent demand walls are anticipated near prior support at $0.00000425.
The contraction between the 100-day EMA ($0.00000525) and the 200-day EMA ($0.00000657) indicates distribution rather than a healthy correction. Previous support around the 50-day EMA now serves as resistance, amplified by the security breach’s reputation hit.
$0.0000039 Support Faces Immediate Test as Sellers Stack Resistance Above
Resistance clusters in the $0.00000433 (10-day EMA) to $0.00000470 (50-day EMA) region, with the psychological $0.0000045 level now acting as resistance and likely solidifying profit-takers on any rebound.
Buyers stepped in at $0.0000039, triggering a 20% recovery and reinforcing this critical level. Bulls must break lower-high patterns near $0.0000046 and hold $0.0000039 to establish a daily uptrend and prevent accumulation under current lows.
The market structure supports distribution as long as PEPE retests below $0.00000433. Volume spiked 45% above the 10-day average on the slide, confirming authoritative seller presence and a bearish convergence likely to drive prices further south before a base forms.
Website Hack Aftermath Makes $0.0000032 Target Likely Before Recovery
Buyers need to prevent a deeper fall or PEPE may visit the April low ($0.00000255) and form a double bottom with a slightly lower low between $0.00000241–$0.00000250.
If the price rebounds sharply and pushes through $0.0000047, it may attempt to trade back toward $0.0000065 heading into next month, though short-term resistance at $0.00000475 could provoke another fallback. A weekend bounce is possible but unlikely to breach $0.000005.
Considering the technical breakdown and security breach, the most likely short-term trajectory is a test of $0.0000032 as a new base. Rallies will be capped until the team resolves security issues and restores investor confidence, which will take time.