ONDO Darts Toward Critical Support After 45% Washout From Highs
Market Structure Shifts Lower
- ONDO tests six-month lows at $0.54 following devastating 45% slide from yearly peaks
- Sellers dominate with ADX climbing past 40, signaling conviction behind the downtrend
- Bulls defend multi-test support zone while awaiting regulatory clarity catalyst
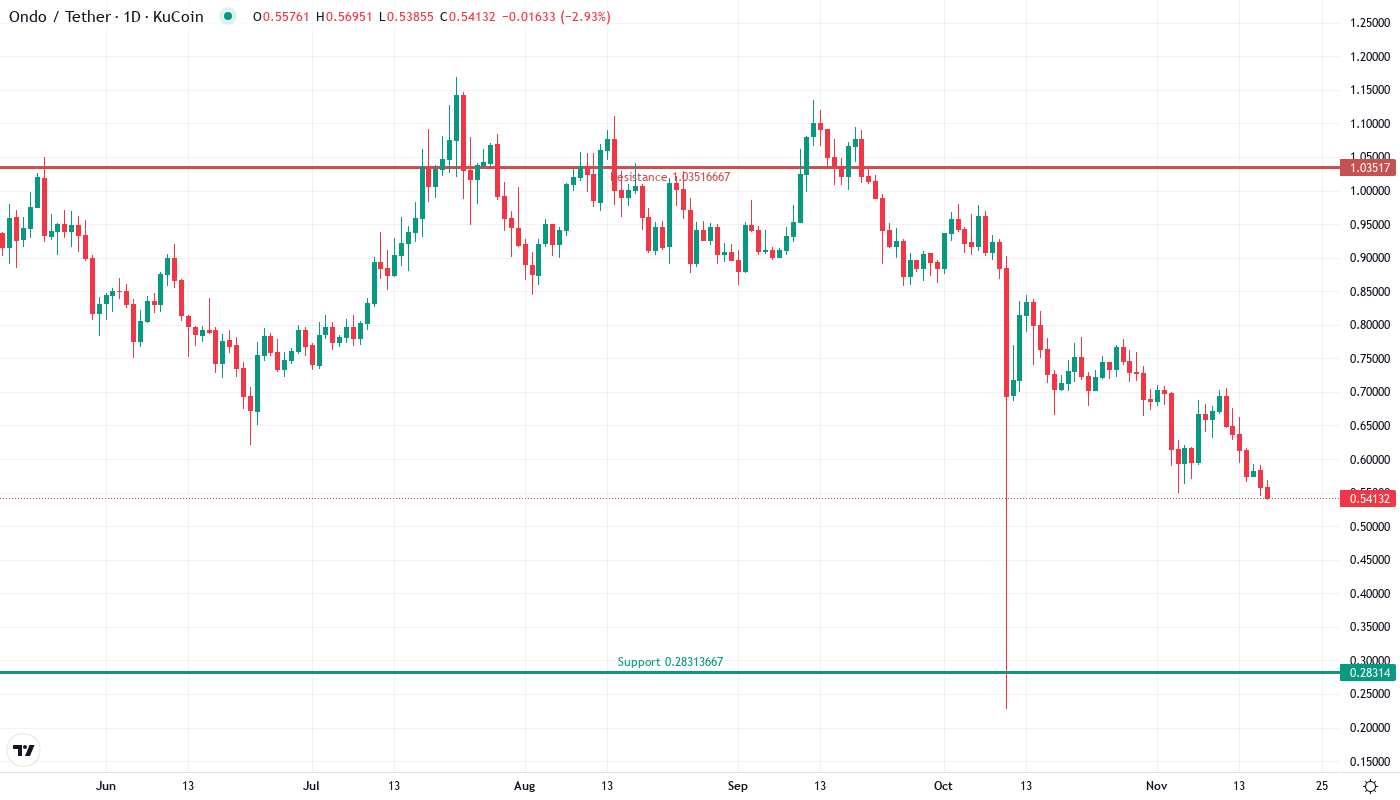
ONDO’s price action tells a story of exhaustion and capitulation, with the token shedding 19% over the past week and 23% monthly to trade at $0.54. The decline from $0.78 monthly highs represents a devastating drop that has erased nearly half the token’s value from its yearly peak, leaving traders questioning whether this crucial support zone will hold. The main question for traders is: can bulls leverage positive regulatory developments—including the Senate crypto draft bill and Ondo’s recent acquisition of SEC-registered Oasis Pro—to stage a meaningful recovery, or will technical weakness overwhelm fundamental catalysts?
| Metric | Value |
|---|---|
| Asset | ONDO (ONDO) |
| Current Price | $0.54 |
| Weekly Performance | -19.10% |
| Monthly Performance | -22.86% |
| RSI (Relative Strength Index) | 32.0 |
| ADX (Average Directional Index) | 43.8 |
| MACD (MACD Level) | -0.05 |
| CCI (Commodity Channel Index, 20-period) | -135.15 |
Momentum Exhaustion Signals Capitulation Phase Complete
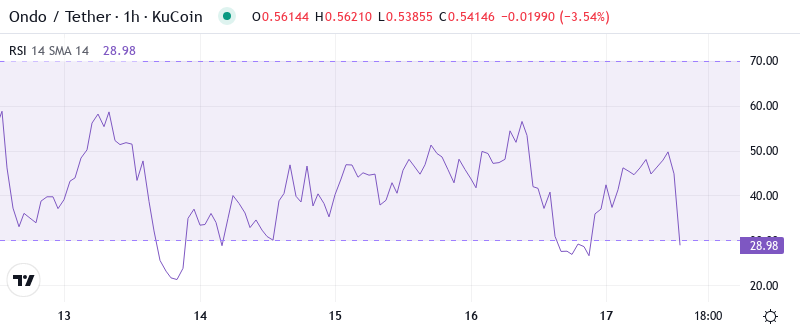
RSI sits at 32.01 on the daily timeframe, marking the first genuine oversold reading since the August washout that preceded a 40% relief rally. What’s revealing is how RSI behaved during the descent—it barely budged above 40 during minor bounces, confirming persistent selling pressure that allowed no meaningful rebounds. The oscillator’s current configuration mirrors September’s pre-rally setup when similar oversold extremes marked a tradeable bottom.
So for swing traders, this deeply oversold RSI combined with Ondo’s strengthened regulatory position through the Oasis Pro acquisition creates an intriguing risk-reward setup. Historical patterns suggest oversold bounces from sub-35 RSI typically generate 15-20% moves higher, though sustained recovery requires reclaiming the 50 neutral zone. The Senate draft bill pushing clearer crypto rules adds fundamental support to what technicals suggest could be an exhaustion point.
ADX Above 40 Confirms Mature Downtrend Nearing Exhaustion
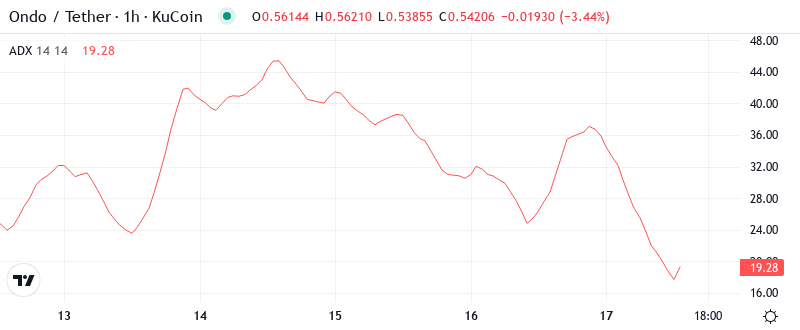
At the level of 43.84, the ADX entry indicates extreme trend strength that historically marks reversal zones for ONDO. Basically, being in this zone means the selling has been so persistent and one-sided that mean reversion becomes increasingly probable. The indicator hasn’t touched these extremes since the March capitulation that ultimately formed a major bottom.
Therefore, day traders should suit their strategies to this change from trending to potential reversal conditions. When ADX peaks above 40, it often signals trend exhaustion rather than continuation—especially when combined with oversold momentum readings. The recent news about potential commodity classification for major tokens could provide the catalyst needed to flip this extreme bearish sentiment.
50-Day EMA at $0.72 Becomes Distant Resistance After Support Failure
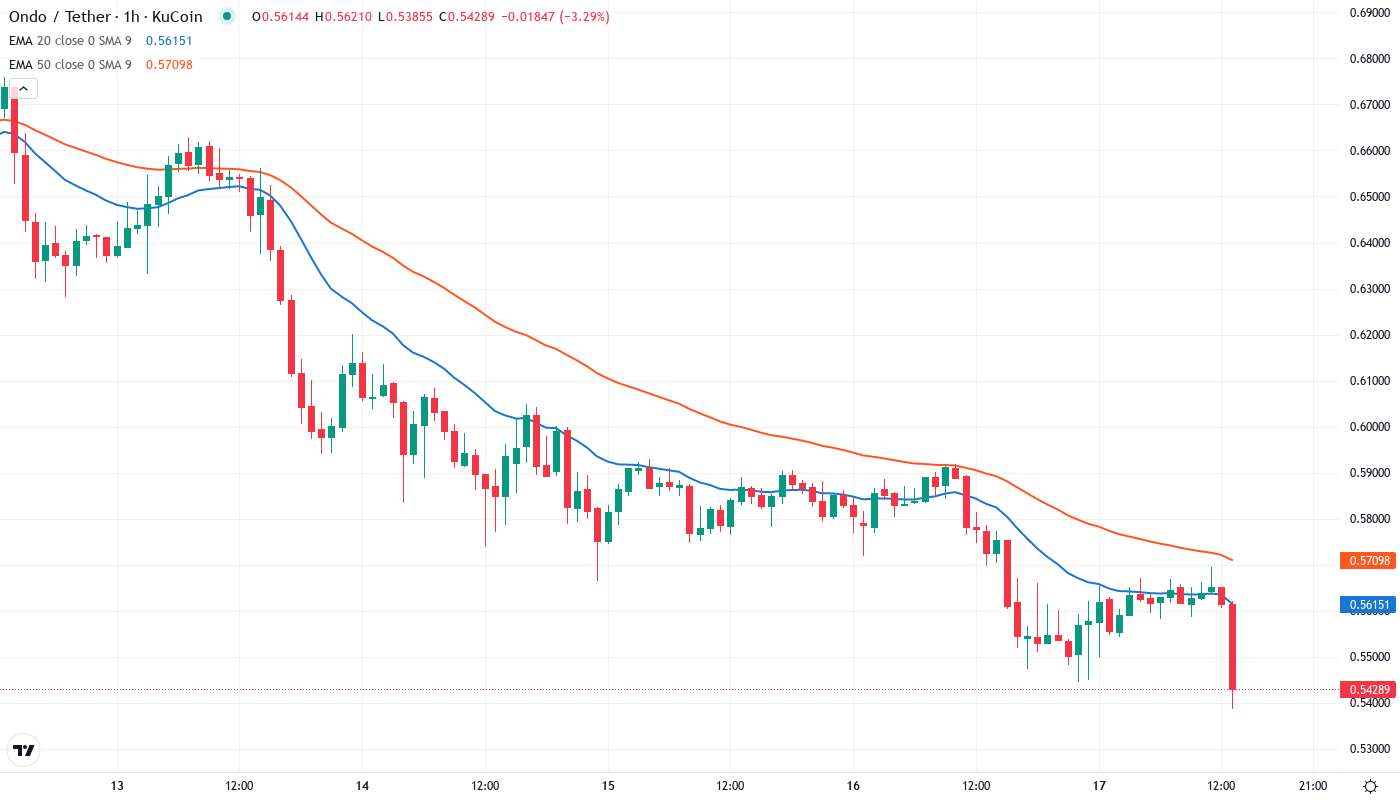
Price action is very clear through the EMA ribbons. ONDO trades deeply below all major moving averages, with the 10-day ($0.60), 20-day ($0.64), and 50-day EMA at $0.72 all acting as overhead resistance. The 50-day EMA changed from being a support level to a resistance one after price convincingly broke below it three weeks ago, accelerating the decline.
Looking at the moving average structure, the compression between short-term EMAs suggests consolidation may be forming near current levels. The 200-day EMA sits far above at $0.86, representing the ultimate test for any sustained recovery attempt. Bulls need to first reclaim the 20-day EMA at $0.64 to shift near-term momentum, a move that would align with ONDO’s improved institutional positioning following SEC registrations.
Support Zone at $0.54 Tested Multiple Times—Still Holding
The immediate support has proven remarkably resilient at the current $0.54 level, which has been tested six times since June without a decisive breakdown. Below this, the next meaningful support doesn’t emerge until the $0.28-$0.33 zone where monthly S2 and S3 pivots cluster—representing another 40-50% decline that would essentially erase all of 2024’s gains.
Resistance stacks heavy between the psychological $0.60 level and the 20-day EMA at $0.64, with sellers defending this zone aggressively on recent bounce attempts. The monthly pivot at $0.63 adds another layer of resistance, creating a formidable barrier for any recovery attempt.
This configuration resembles a compressed spring, with the tightening range between $0.54 support and $0.64 resistance setting up for a decisive directional move. The structure signals that whichever side breaks first will likely see acceleration in that direction—with regulatory clarity potentially serving as the catalyst.
Bulls Need Decisive Close Above $0.64 to Confirm Recovery
Bulls require a decisive close above the 20-day EMA at $0.64 to flip near-term structure bullish, opening targets toward the 50-day EMA at $0.72. Should ONDO reclaim these levels while the Senate crypto bill advances and institutional adoption through Oasis Pro gains traction, the measured move points toward $0.85-$0.90.
The setup fails if price loses the $0.54 support that has held through six tests, which would trigger stops and likely flush positions toward the $0.28-$0.33 zone. Such a breakdown would trap recent buyers betting on regulatory catalysts and create a cascade effect as overleveraged longs unwind.
Given the technical exhaustion signals, oversold conditions, and fundamental tailwinds from regulatory developments, the most probable near-term path is for ONDO to stage a relief bounce toward $0.60-$0.64 resistance before the market determines whether this represents a dead cat bounce or the start of genuine trend reversal.