Ondo Darts Through December Lows as $200M Investment Plan Meets Technical Resistance
Market Pulse
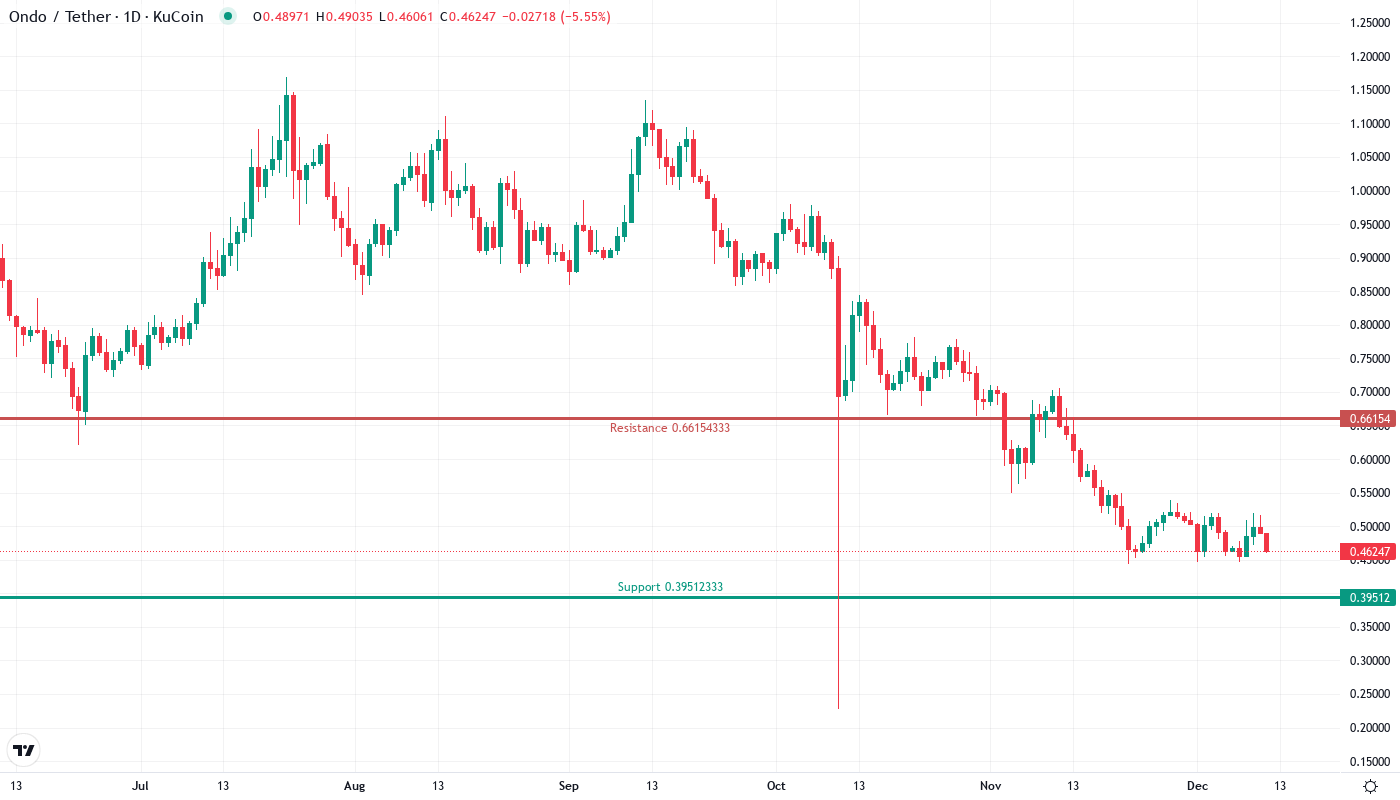
- Price action tests $0.46 support for sixth consecutive day despite institutional backing
- Momentum indicators flash capitulation signals not seen since August bottom
- ADX climbs above 39, signaling strong directional move building steam
Ondo Finance finds itself caught in a fascinating paradox – garnering heavyweight institutional partnerships with State Street and Galaxy while its native token ONDO bleeds out technically. The cryptocurrency tumbled 34% over the past month to $0.463, even as the protocol surpassed $1.81 billion in total value locked and announced a $200 million seed investment plan for tokenized liquidity funds. This disconnect between fundamental strength and price weakness has created one of crypto’s most intriguing setups. The main question for traders is: will the technical capitulation finally align with the protocol’s growing institutional adoption, or does further downside await before smart money steps in?
| Metric | Value |
|---|---|
| Asset | ONDO (ONDO) |
| Current Price | $0.46 |
| Weekly Performance | -9.81% |
| Monthly Performance | -33.27% |
| RSI (Relative Strength Index) | 39.0 |
| ADX (Average Directional Index) | 39.9 |
| MACD (MACD Level) | -0.03 |
| CCI (Commodity Channel Index, 20-period) | -78.29 |
RSI at 40.3 Matches August Capitulation – Oversold Bounce Territory
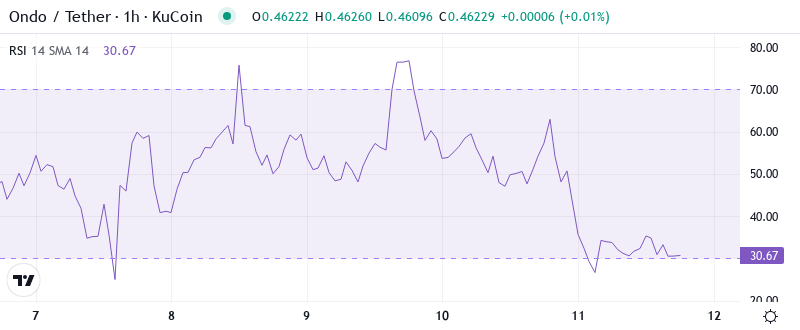
Reading the oscillator at 40.29 on the daily timeframe reveals momentum exhaustion approaching levels that previously marked significant bottoms. Similar RSI configurations in August preceded a 45% relief rally within two weeks, suggesting the selling pressure may be running out of steam. The weekly RSI sits even lower at 27.20, marking the most oversold condition on higher timeframes since the protocol’s early trading days.
What’s revealing is how RSI barely budged despite yesterday’s State Street partnership announcement – typically news of this caliber would spark at least a momentum spike. So for swing traders, this muted response suggests either maximum pessimism is already priced in, or the market needs to see concrete TVL growth from these partnerships before buyers return. The disconnect between improving fundamentals and deteriorating technicals often marks inflection points, though timing the turn requires patience.
Strong ADX at 39.9 Confirms Mature Downtrend Nearing Exhaustion
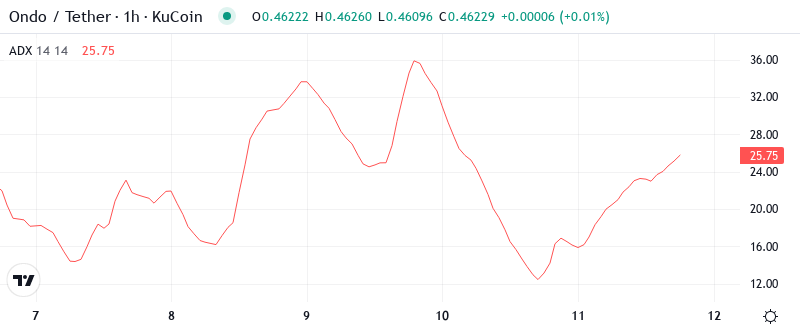
At the level of 39.95, the ADX entry indicates we’re deep into trending conditions – specifically a powerful downtrend that’s been gaining steam since early December. Basically, readings above 35 signal strong directional movement, and approaching 40 typically marks the exhaustion phase where trends either accelerate into climax or begin losing momentum. The sustained high ADX reading confirms sellers have maintained control despite multiple support tests.
Interestingly enough, extreme ADX readings above 40 historically precede trend reversals for ONDO within 5-10 trading days. To clarify, the ADX is indicating that while the current downtrend remains intact, we’re entering the zone where counter-trend bounces become increasingly probable. Therefore, day traders should prepare for potential volatility expansion as this mature trend approaches its natural conclusion – either through capitulation below $0.44 or a sharp reversal if institutional flows materialize from the announced $200M investment plan.
20-Day EMA at $0.50 Caps Rally Attempts as MAs Paint Bearish Picture
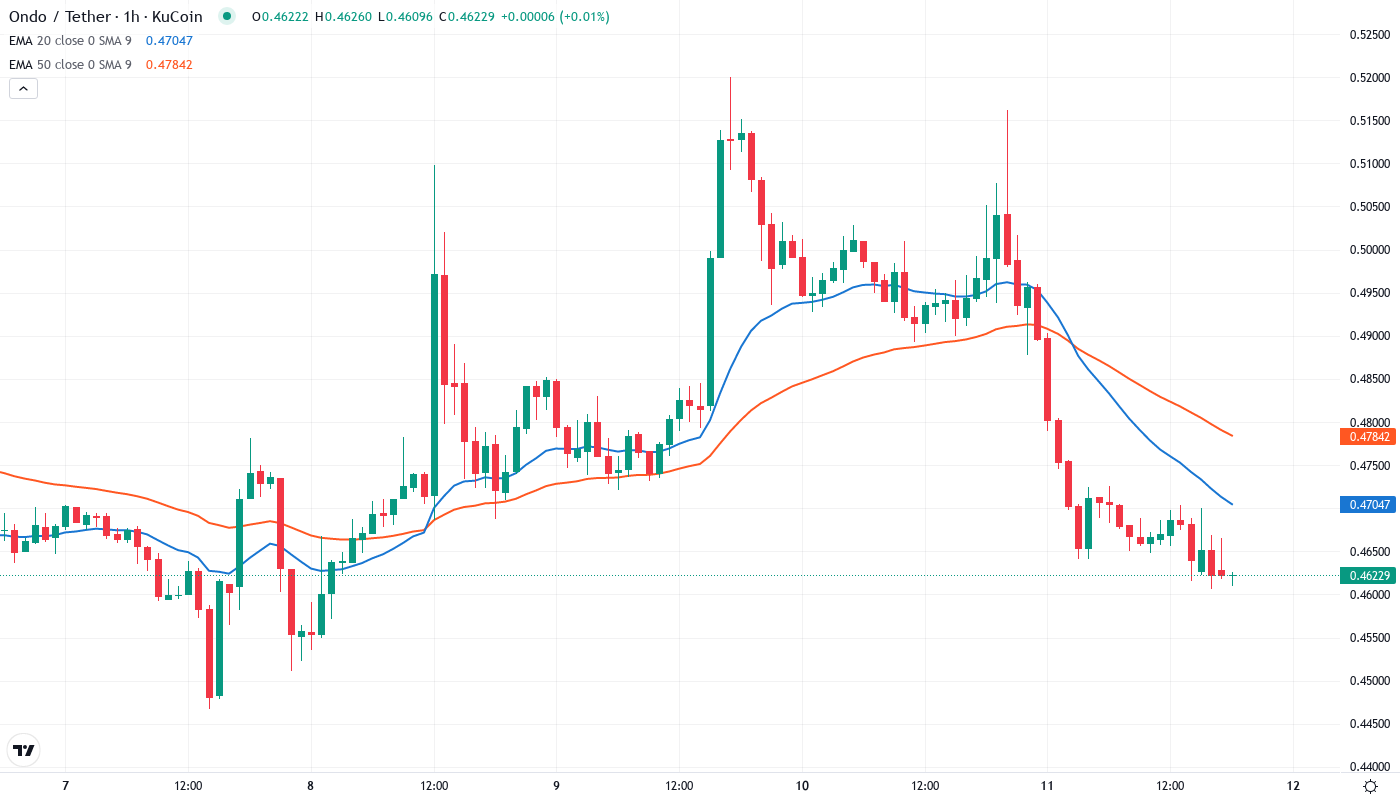
Price action tells a clear story through the EMA ribbons – ONDO trades below every major moving average, with the 10-day ($0.483) and 20-day ($0.500) EMAs acting as dynamic resistance on any bounce attempts. More concerning, the 50-day EMA at $0.579 sits 25% above current prices, illustrating just how severely this correction has damaged the technical structure. The recent State Street partnership announcement briefly pushed price toward the 10-day EMA before sellers emerged, confirming these levels as formidable barriers.
Looking at the broader moving average architecture, the 100-day and 200-day EMAs converge in the $0.68-0.88 zone – roughly 50-90% above current levels. This massive gap between price and long-term averages suggests two possibilities: either ONDO is deeply oversold and due for mean reversion, or the tokenized asset narrative faces headwinds the market hasn’t fully digested yet. The 50-day EMA at $0.579 becomes the first major hurdle for any sustainable recovery, requiring roughly 25% appreciation just to reach this initial resistance.
Support at $0.44 Faces Seventh Test as Resistance Stacks From $0.54 to $0.67
The immediate resistance clusters between $0.528 and $0.553, where December’s breakdown point meets the psychological half-dollar level. This zone rejected advances three times over the past two weeks, despite positive newsflow including the Galaxy partnership and SWEEP fund launch. Above that, major resistance awaits at $0.615-0.676, coinciding with November’s consolidation range and the monthly pivot points.
Bulls defend the $0.444 support with increasing desperation – this level has withstood six tests since mid-December, but each bounce grows weaker. The weekly low at $0.444 represents the final defensive line before opening an air pocket toward $0.35, where virtually no historical trading occurred. Volume profiles show minimal support between $0.44 and $0.35, suggesting any breakdown could accelerate quickly.
Market structure reveals an interesting divergence – while spot prices grind at multi-month lows, Ondo Finance’s TVL growth and institutional partnerships paint a fundamentally bullish picture. This disconnect often resolves violently in one direction. The compression between stubborn support at $0.444 and descending resistance from $0.528 creates a coiled spring formation that should break definitively within days.
Breakdown Below $0.44 Opens Path to $0.35 Unless Institutions Step In
Bulls require a decisive close above $0.528 to shift near-term momentum, with follow-through past $0.553 needed to confirm a sustainable reversal. Such a move would likely coincide with concrete deployment of the announced $200M investment fund or measurable TVL growth from the State Street collaboration. Without catalyst-driven buying, the technical picture remains dire.
The bearish scenario triggers if $0.444 support finally cracks on volume – this would trap recent bottom-fishers and likely cascade toward $0.35 or lower. Given six failed attempts to break this level, its eventual loss would carry psychological weight beyond the technical implications. Weekly closes below $0.44 would confirm continuation of the four-week downtrend.
Considering the extreme oversold conditions, high ADX readings suggesting trend exhaustion, and significant fundamental developments in the pipeline, the most probable near-term path sees ONDO staging a relief bounce toward $0.52-0.55 resistance before the larger trend reasserts. However, traders should note that oversold conditions can persist longer than expected when institutional adoption narratives meet skeptical markets.