Ondo Darts Into European Markets as Price Tests Critical Support at $0.47

Market Structure Shifts Higher
- European regulatory approval opens path for tokenized stock offerings across 30 countries
- Price consolidates at $0.47 after dropping 37% from December’s peak
- Technical indicators flash oversold conditions not seen since market-wide August washout
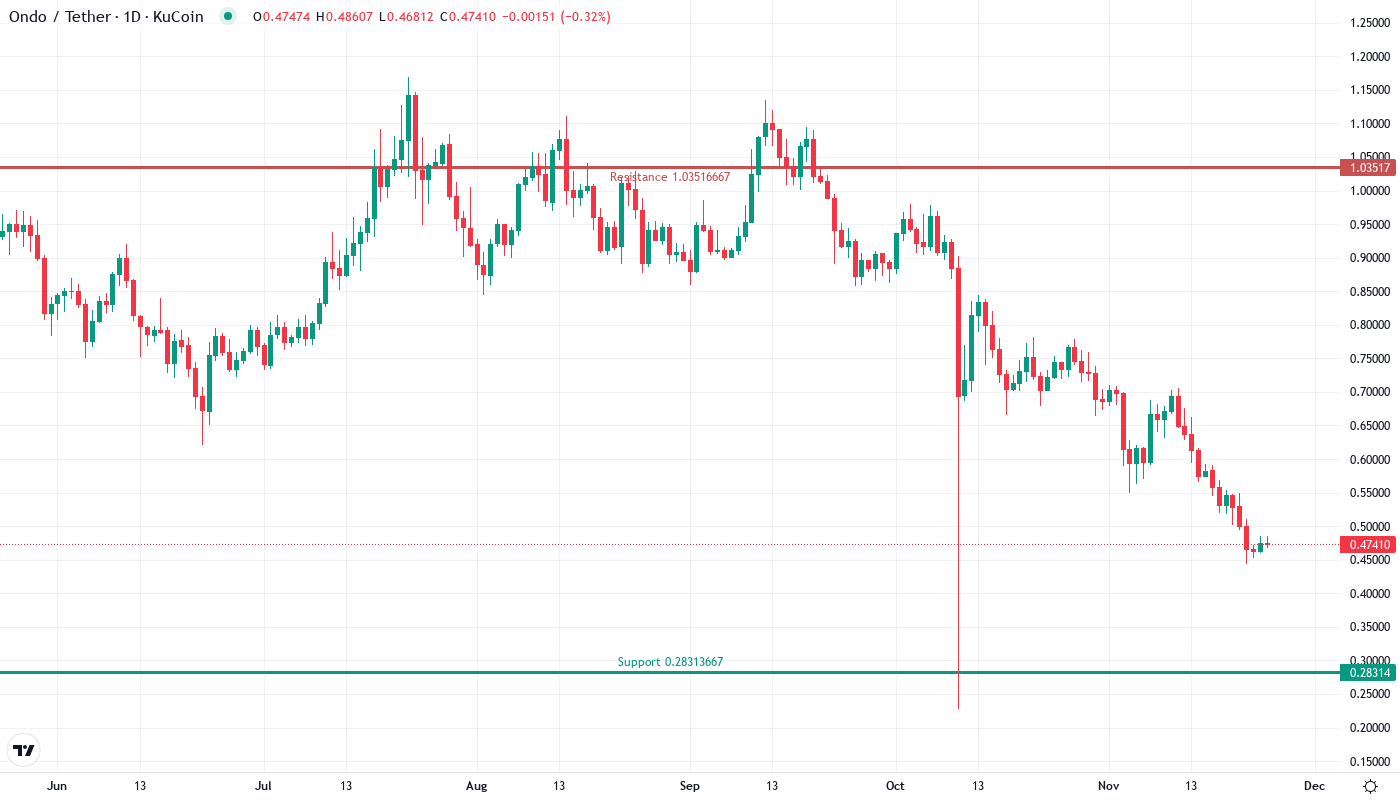
Ondo’s price action tells a tale of two narratives this week. The token trades at $0.47, down 37% over the past month, yet the fundamental backdrop just shifted dramatically with European regulatory approval to offer tokenized stocks and ETFs across 30 countries. This devastating drop from December highs near $0.78 has pushed multiple technical indicators into oversold territory for the first time since August’s market-wide capitulation. The main question for traders is: will the European expansion news provide enough fuel to reverse the month-long bleed, or do bears have more room to run?
| Metric | Value |
|---|---|
| Asset | ONDO (ONDO) |
| Current Price | $0.47 |
| Weekly Performance | -14.88% |
| Monthly Performance | -36.21% |
| RSI (Relative Strength Index) | 29.2 |
| ADX (Average Directional Index) | 49.9 |
| MACD (MACD Level) | -0.06 |
| CCI (Commodity Channel Index, 20-period) | -108.36 |
RSI Plunges to 29.19 – Deepest Oversold Reading Since August Crash
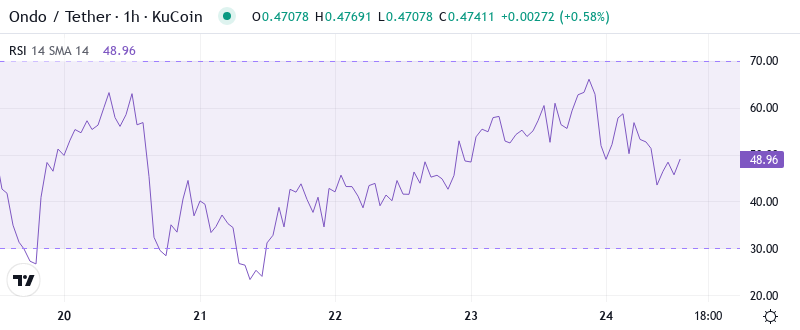
The RSI index stands currently at 29.19 on the daily timeframe, marking the most extreme oversold condition since the August market washout when ONDO bottomed near $0.32. This reading sits well below the traditional oversold threshold of 30, suggesting seller exhaustion may be approaching. What’s interesting is how rapidly momentum collapsed – just four weeks ago, RSI peaked above 70 as price touched $0.78.
Similar RSI configurations in August and September preceded sharp relief rallies of 25-40% within days of hitting these extreme lows. The European regulatory approval news landed precisely as RSI touched this critical oversold zone, potentially providing the catalyst for mean reversion. So for swing traders, this deeply oversold RSI combined with game-changing fundamental news creates a high-probability bounce setup, though catching falling knives requires strict risk management.
ADX at 49.85 Signals Powerful Downtrend – But Exhaustion Looms
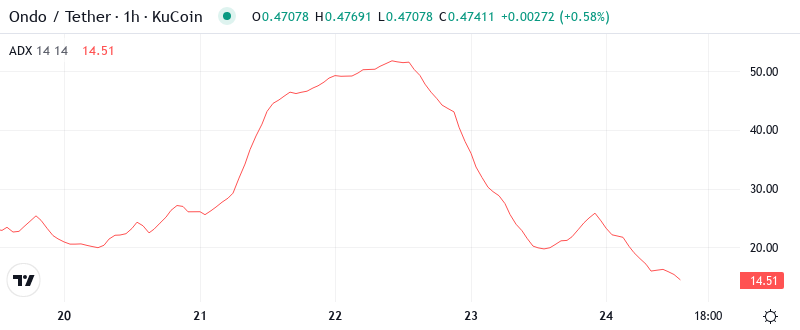
At the level of 49.85, the ADX entry indicates that the trend is experiencing extreme directional movement rarely seen in ONDO’s trading history. This reading above 40 typically marks mature trends approaching exhaustion points. Basically, being in this zone means the selling pressure has been relentless and conviction-driven, not merely profit-taking or gentle corrections.
Trend followers who rode this move down from $0.78 should consider taking profits as ADX readings above 45 historically preceded trend reversals within 3-7 trading days. The combination of extreme ADX, oversold RSI, and positive regulatory news creates conditions ripe for at minimum a counter-trend bounce. Therefore, day traders should suit their strategies to this potential inflection point – the rubber band is stretched to its limits.
20-Day EMA at $0.56 Becomes First Major Resistance Target
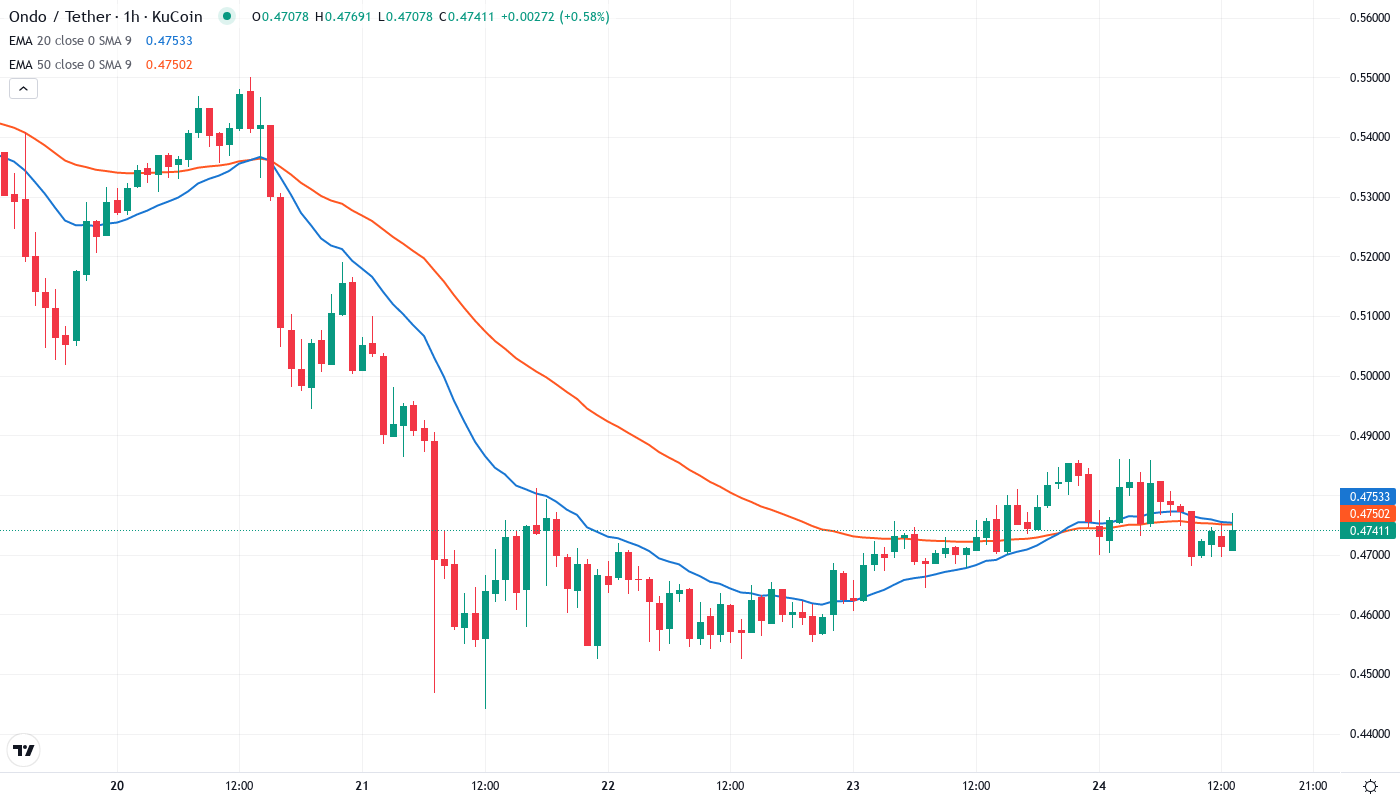
Price action through the EMA ribbons paints a stark picture of the current downtrend. ONDO trades below the entire moving average stack – the 10-day ($0.51), 20-day ($0.56), 50-day ($0.66), and 200-day EMA at $0.76. The 50-day EMA particularly stands out, having rejected price advances three times during December’s distribution phase before finally giving way.
What’s revealing is the compression between current price at $0.47 and the 10-day EMA at $0.51 – just an 8.5% gap. This proximity suggests the first real test for any European news-driven bounce will come quickly. That former support area at the 20-day EMA ($0.56) now transforms into a red line for bulls to reclaim if they want to signal anything more than a dead cat bounce. The 50-day at $0.66 looms as the major trend-defining level – reclaiming it would shift the entire structure bullish.
Support Architecture Crumbles Below $0.47 – Next Safety Net at $0.32
The immediate resistance is set at the zone from $0.52 to $0.56 where the 10-day and 20-day EMAs converge with December’s volume-weighted average price. Above that, sellers have stacked orders at the psychological $0.60 level, which aligns with the weekly pivot point. The monthly pivot R1 at $0.63 and the 50-day EMA at $0.66 create a formidable resistance band that would require significant buying pressure to overcome.
Bulls defend the current $0.47 level desperately – it represents both the weekly low and a 40% retracement from December highs. Below here, the support structure looks dangerously thin until the August lows near $0.32, which would mark a 57% drawdown from recent peaks. The monthly pivot at $0.28 provides the absolute last-ditch support before entering uncharted bearish territory.
This configuration resembles a compressed spring, with the European regulatory approval potentially providing the energy for expansion in either direction. The lack of meaningful support below current levels makes this a particularly precarious setup – any failure here could trigger another leg down toward $0.35-0.32 as stop losses cascade. Conversely, the oversold conditions and positive news create potential for a violent short squeeze if buyers can push price back above $0.52.
European Expansion News Makes $0.52 Reclaim Critical for Recovery
Bulls must secure a daily close above $0.52 to confirm the European regulatory catalyst has shifted momentum. This level represents the convergence of the 10-day EMA and the first Fibonacci retracement, making it the minimum requirement for a sustainable bounce. Should ONDO reclaim this zone with volume, the path opens toward $0.56-0.60, where the real battle begins against the 20-day EMA and psychological resistance.
The bearish scenario triggers if price fails to hold $0.47 on a daily close despite the positive regulatory news. Such a rejection would signal that even game-changing fundamentals cannot overcome the technical damage, likely flushing positions down to the $0.35-0.32 support zone. This would trap recent buyers who entered on the European news, creating additional selling pressure from underwater longs.
Given the extreme oversold conditions coinciding with transformative regulatory approval, the most likely short-term path is a relief rally toward $0.52-0.56 before sellers regroup at higher levels. The sustainability of any bounce depends entirely on whether institutional players view the European expansion as sufficient reason to accumulate at these discounted levels versus December’s euphoric highs.