OKB Tumbles 32% From Monthly Peak as Exchange Token Momentum Stalls
Market Structure Shifts Lower
- OKB shed $41.02 in December, erasing five months of gains
- Exchange token outperformance reverses despite Q3 strength reports
- Bulls defend $115 support after six-figure psychological level cracks
OKB has endured a devastating drop from its monthly high of $174.29 to current levels at $115.67, marking a 32.27% decline that wipes out gains accumulated since July. The exchange token’s reversal comes despite broader sector strength highlighted in Q3 reports showing exchange tokens outperforming Bitcoin – a disconnect that has trapped late buyers who chased the narrative. The main question for traders is: can bulls hold the line at $115 support, or will the breakdown accelerate toward double-digit territory?
| Metric | Value |
|---|---|
| Asset | OKB (OKB) |
| Current Price | $115.67 |
| Weekly Performance | -6.39% |
| Monthly Performance | -32.27% |
| RSI (Relative Strength Index) | 32.3 |
| ADX (Average Directional Index) | 51.4 |
| MACD (MACD Level) | -13.67 |
| CCI (Commodity Channel Index, 20-period) | -83.39 |
RSI at 32.34 Signals First Oversold Territory Since Spring Washout
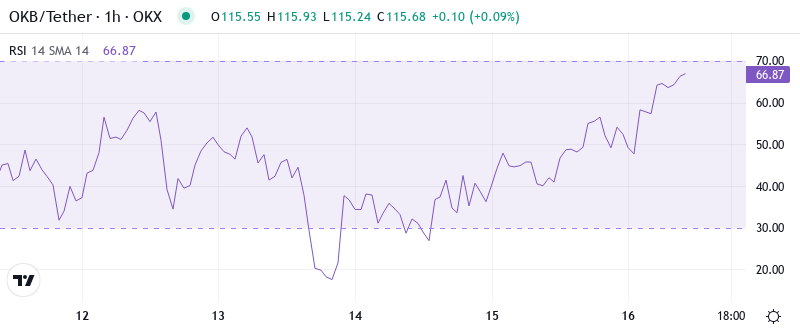
RSI sits at 32.34 on the daily timeframe, plunging into oversold territory for the first time since the March market-wide deleveraging event. This sharp momentum deterioration from last month’s overbought extremes above 70 represents one of the most violent resets in OKB’s recent history. The speed of decline suggests capitulation rather than healthy correction, with sellers overwhelming any dip-buying attempts as the perpetual contract launch failed to provide the expected liquidity boost.
What’s revealing is how RSI barely budged during yesterday’s relief bounce attempt – the oscillator remains pinned in oversold conditions despite a 3% intraday recovery. Similar momentum exhaustion in March preceded a two-month base-building phase before the next sustainable rally. So for swing traders, this deeply oversold reading creates a high-risk, high-reward setup where any positive catalyst could spark a sharp relief rally, though the primary trend remains decisively bearish until RSI reclaims the 40 level.
ADX Surges to 51.38 as Downtrend Gains Devastating Momentum
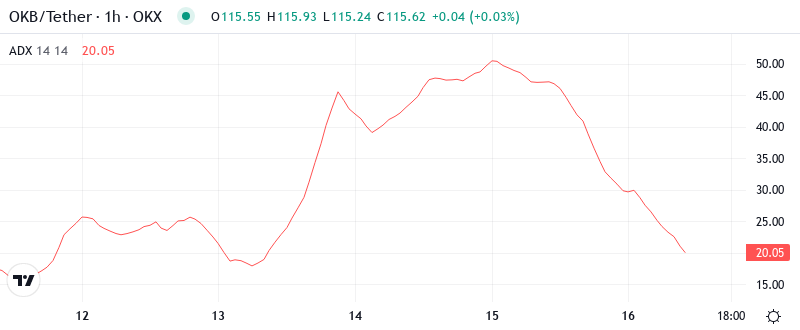
At the level of 51.38, the ADX entry indicates extreme trending conditions – the highest reading since OKB’s inception. This isn’t just a pullback anymore; it’s a full-blown trend reversal with conviction. The indicator crossed above 25 in early December when price first rejected at $174, and has accelerated parabolically as each support level failed to hold. Basically, when ADX reaches these extremes above 50, it signals either trend exhaustion approaching or acceleration into capitulation – and current price action suggests the latter.
Trend followers who waited for ADX confirmation above 25 caught the meat of this move from $160 down to current levels. The concerning aspect is that ADX shows no signs of rolling over yet, which typically precedes a trend pause or reversal. Therefore, day traders should adapt strategies for continued volatility and avoid catching falling knives until ADX begins declining from these extreme readings. The exchange token sector rotation that drove Q3 outperformance has completely unwound, leaving momentum traders little choice but to wait for trend exhaustion signals.
20-Day EMA at $130.59 Becomes Next Major Resistance Hurdle
Price action through the EMA ribbons paints a grim picture for bulls. OKB currently trades below every significant moving average – the 10-day ($120.54), 20-day ($130.59), 50-day ($148.87), and 100-day ($145.11) all sit overhead as resistance. Most telling is how the 50-day EMA rejected price three times in December before the breakdown accelerated. That former support area has transformed into a formidable ceiling that bulls must reclaim to shift the narrative.
Looking at the moving average structure, the compression between the 10-day and 20-day EMAs suggests a potential bear flag formation. The golden cross from October has reversed into an impending death cross as shorter-term averages plunge through longer-term ones. This technical deterioration aligns with the failed perpetual contract launch catalyst – what should have driven increased trading volume instead coincided with distribution. Bulls need to reclaim the 20-day EMA at $130.59 as a first step toward repairing the damaged structure.
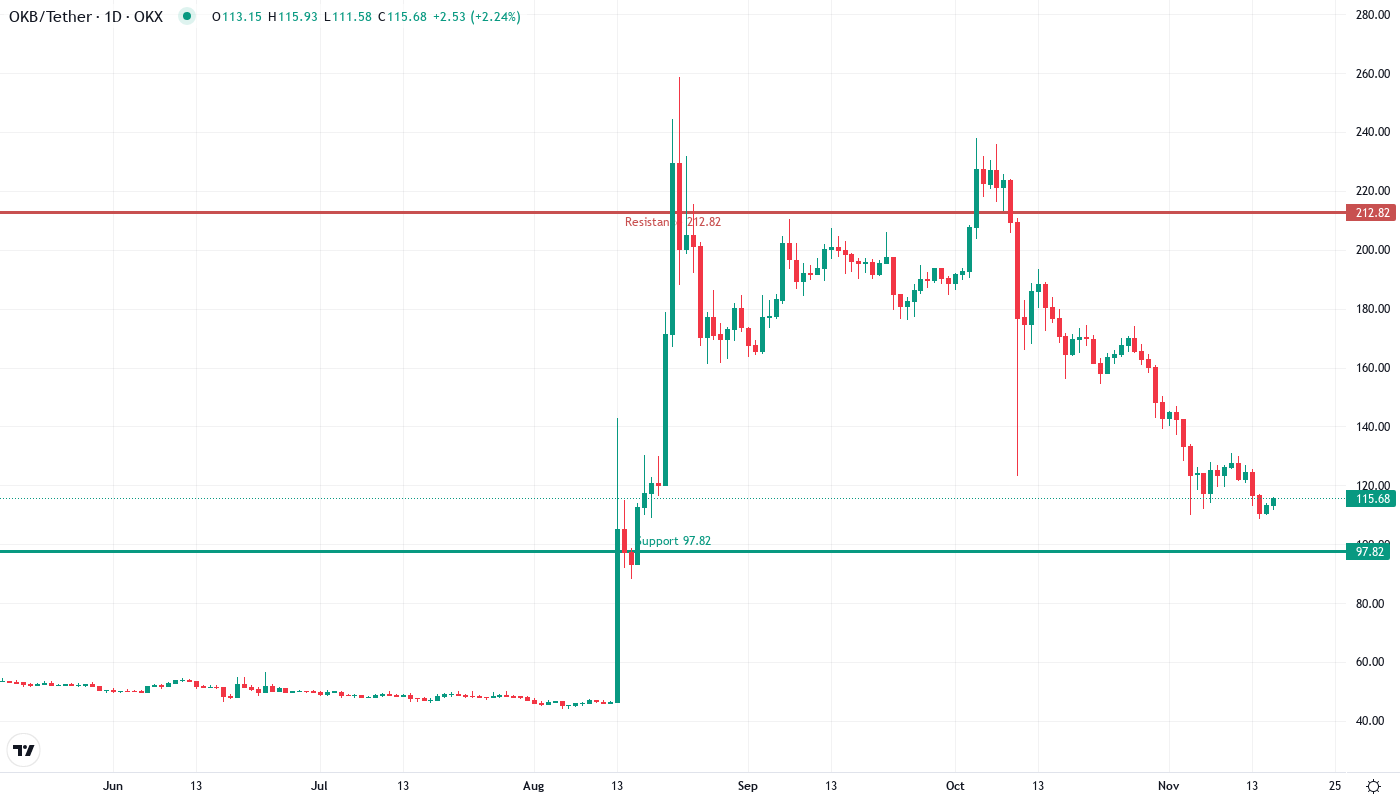
Support Crumbles at $115 While Resistance Stacks From $142 to $174
The immediate resistance clusters between $141.20 (weekly pivot) and $147.33 (monthly R1), forming a supply zone that coincides with the 50-day EMA. Above that, the December highs at $174.29 feel impossibly distant given current momentum. Each rally attempt faces heavier selling as underwater longs exit positions, creating natural resistance at every $5 increment where buyers are trapped from the decline.
Bulls defend the $115.67 support level that has held through multiple tests this week, though each bounce grows weaker. The weekly S1 at $98.55 looms as the next major support if current levels fail, representing another 15% downside risk. This $98-$99 zone gains importance as it aligns with the psychological $100 level and the 200-day EMA at $121.48 adjusted for the current trajectory.
Market structure reveals a clear shift from accumulation to distribution. The failure to hold above the monthly pivot at $147.33 after the OKX perpetual contract announcement marked the transition point. Volume patterns show heavy selling into strength rather than panic liquidations at lows – a sign that larger players are distributing positions rather than accumulating. This structural breakdown suggests lower prices ahead unless a significant catalyst emerges to reverse sentiment.
Bears Target $98 Support as Distribution Phase Accelerates
Bulls require a daily close above $130.59 to neutralize immediate bearish pressure and target $142 resistance. The combination of oversold RSI and extreme ADX creates conditions for a relief bounce, but any rally likely faces heavy supply from underwater positions. Without fresh catalysts beyond the failed perpetual contract launch, sustained recovery appears unlikely in the near term.
The bearish scenario accelerates if $115 support cracks on volume – this would trigger stops and likely flush positions toward the $98-$99 support cluster. Such a move would represent a 47% total decline from December highs and potentially mark a long-term bottom given the psychological importance of the $100 level. The absence of buying interest despite Q3 exchange token outperformance suggests the narrative has shifted.
Given current momentum and technical deterioration, the most probable near-term path sees OKB grinding between $110-$125 as oversold conditions work off through time rather than price. The extreme ADX reading must cool before any sustainable recovery attempt, while the failed perpetual contract catalyst removes a key fundamental support that bulls were counting on to drive the next leg higher.