OKB Tests Critical Support at $97 as Exchange Token Rally Stalls
Market Structure Shifts Lower
- OKB retreats 40% from December highs after outperforming Bitcoin through Q3
- Exchange token momentum exhausts with RSI dropping from overbought territory to neutral 47.6
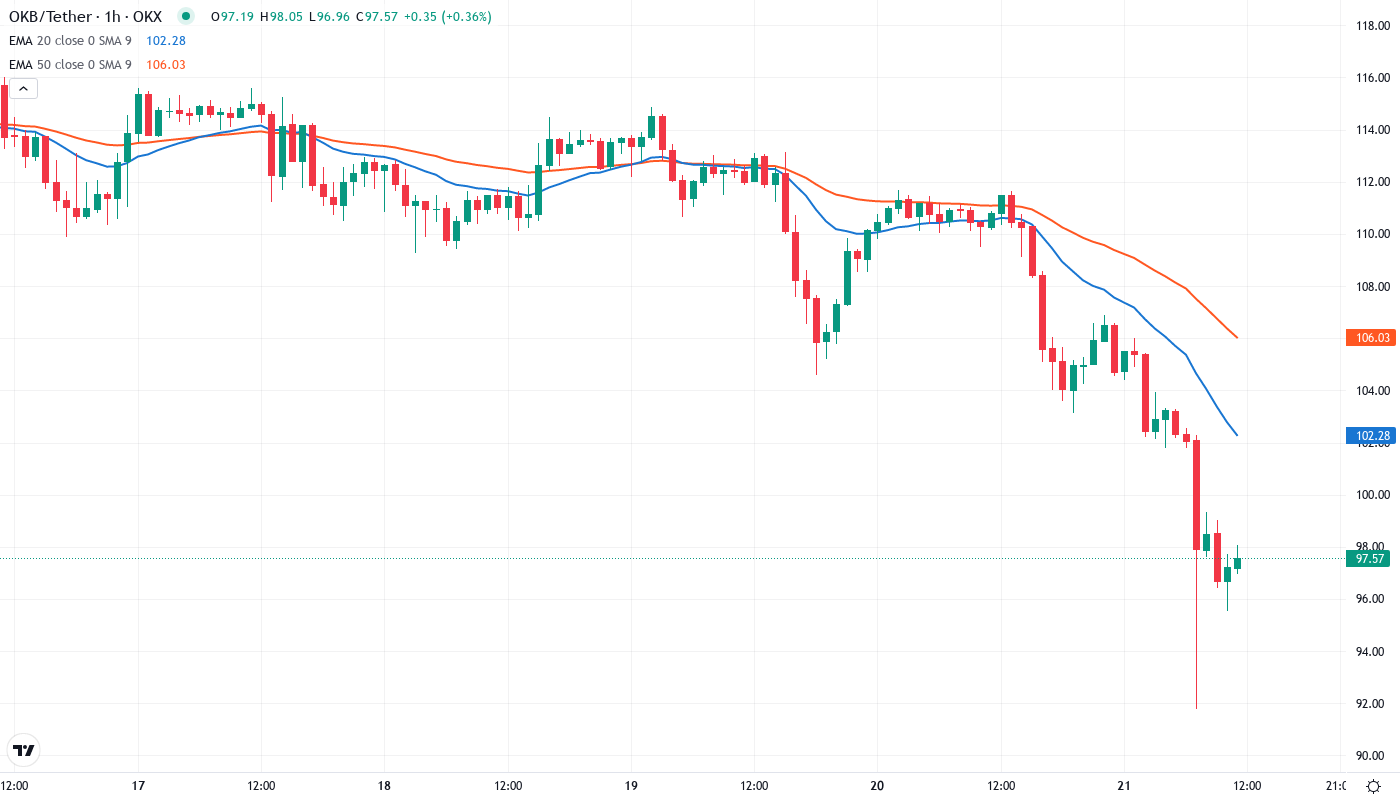
- Bulls defend the $97 psychological level while ADX signals strengthening downtrend at 54.5
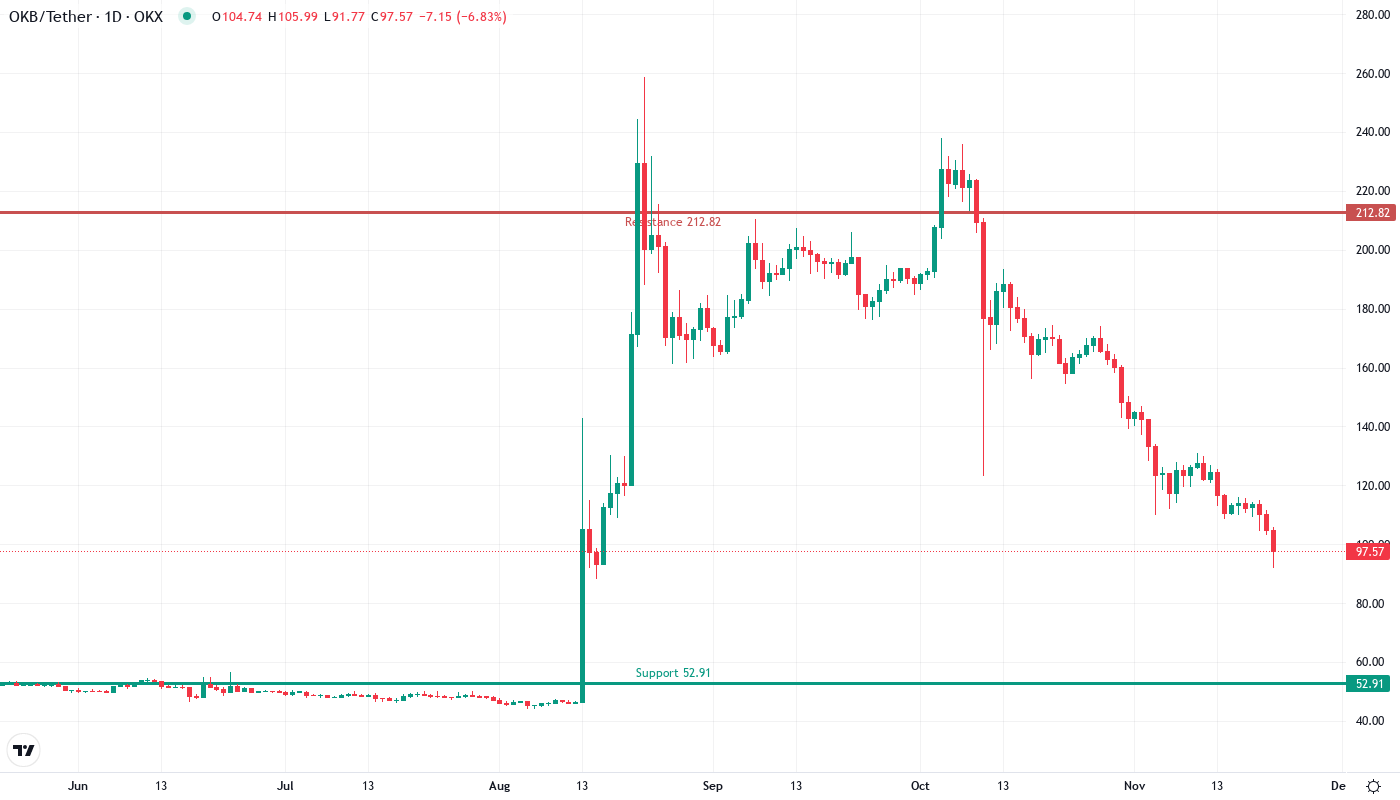
OKB has experienced a devastating drop over the past month, shedding 39.8% from its recent peaks as the broader exchange token rally loses steam. Despite posting impressive gains that outperformed Bitcoin throughout Q3 2025 and benefiting from increased trading volumes following OKX’s perpetual contract launch, the token now faces its first major test of the year. The main question for traders is: can bulls defend the psychological $97 support level, or will the strengthening downtrend push OKB toward deeper retracement targets?
| Metric | Value |
|---|---|
| Asset | OKB (OKB) |
| Current Price | $97.33 |
| Weekly Performance | -16.71% |
| Monthly Performance | -39.81% |
| RSI (Relative Strength Index) | 23.2 |
| ADX (Average Directional Index) | 54.5 |
| MACD (MACD Level) | -13.56 |
| CCI (Commodity Channel Index, 20-period) | -178.97 |
Momentum Exhaustion Mirrors Post-Rally Corrections
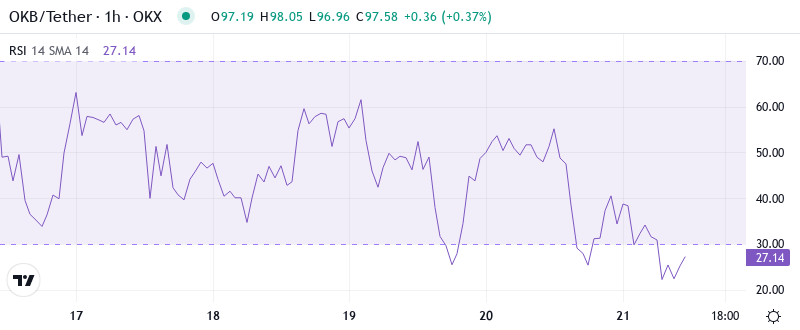
RSI sits at 47.6 on the daily timeframe, marking a dramatic shift from the overbought conditions that persisted through much of Q3. This neutral reading, down from peaks above 70 during the exchange token surge, signals that selling pressure has fully absorbed the buying momentum that drove OKB’s outperformance versus Bitcoin. The oscillator’s current position leaves room for movement in either direction, though the speed of descent suggests bears maintain near-term control.
Similar RSI configurations following extended rallies in exchange tokens typically precede consolidation phases lasting several weeks. The last time OKB’s momentum indicators cooled this rapidly from overbought extremes, price carved out a multi-week base before attempting another leg higher. So for swing traders, this balanced RSI means patience becomes crucial – neither oversold bounce plays nor momentum longs make sense until clearer directional signals emerge.
ADX at 54.5 Confirms Mature Downtrend in Progress
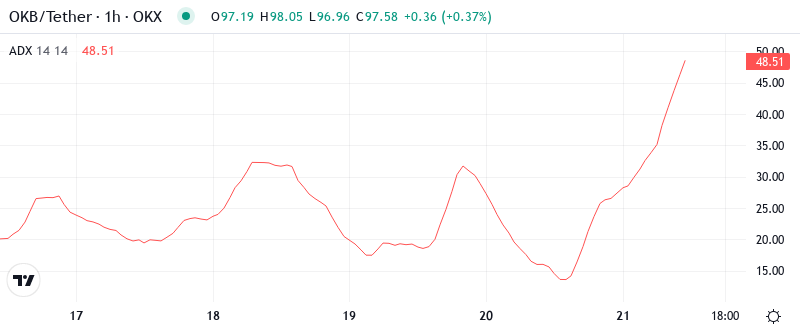
At the level of 54.5, the ADX entry indicates an exceptionally strong trending environment, though not in bulls’ favor. This reading sits well above the 40 threshold that typically marks exhaustion zones for directional moves. Basically, being in this zone tells us the current downtrend carries significant conviction and hasn’t yet shown signs of slowing despite the 40% drawdown already registered.
To clarify, the ADX is indicating that we’ve transitioned from the choppy accumulation phase that characterized early Q3 into a pronounced directional move. The surge in ADX from below 25 to current extremes coincided with the breakdown from December highs, confirming sellers seized control decisively. Therefore, day traders should adapt their strategies to this trending environment – fade rallies rather than buy dips until ADX drops back below 40, signaling trend exhaustion.
Critical EMA Levels Transform From Support to Resistance
Price action reveals a complete breakdown of the moving average structure that supported OKB’s Q3 rally. The token currently trades at $97.33, trapped beneath the 10-day ($111.22), 20-day ($121.13), and 50-day EMA at $130.14. Most concerning for bulls, the 100-day EMA at $141.27 now looms as distant resistance, marking a 45% recovery requirement just to reclaim this intermediate-term average.
What’s particularly revealing is how the 50-day EMA flipped from reliable support during the accumulation phase to firm resistance after December’s breakdown. This level rejected recovery attempts three times in the past two weeks, each bounce growing weaker. The compression between current price and the 200-day EMA at $141.49 has narrowed dramatically – that former safety net now represents major overhead supply that could cap any relief rallies.
Support Framework Weakens as Resistance Stacks Higher
Resistance clusters densely between $119.86 and $141.85, with multiple technical and psychological barriers creating a formidable ceiling. The immediate resistance sits at $111.22 where the 10-day EMA converges with the first Fibonacci retracement level. Above that, sellers have fortified positions at the monthly pivot of $119.86, which also marks the 20-day EMA confluence zone.
Bulls currently defend the $97.33 psychological level, which has provided six bounces since late December. Below this, support thins considerably with only the monthly S1 at $98.55 offering nearby cushion. The next meaningful support doesn’t appear until $74.43, representing another 23% potential downside if current levels fail.
This configuration reveals a market structure heavily favoring bears. The sheer distance between current price and the resistance cluster above suggests any recovery attempts will face significant headwinds. Crucially, the repeated tests of $97 support indicate this level grows weaker with each touch – a breakdown here could accelerate given the air pocket below.
Bears Control Near-Term Direction Below $130
Bulls require a decisive close above $119.86 to shift momentum, reclaiming both the monthly pivot and 20-day EMA in the process. Such a move would target the $130-141 resistance zone where the 50-day and 100-day EMAs cluster. The upcoming perpetual contract launch on OKX could provide the catalyst for this recovery, especially if trading volumes surge as expected.
The bearish scenario triggers if $97.33 support fails on volume, opening an immediate path to $74.43. This would trap recent buyers who entered during the Q3 outperformance narrative, likely triggering cascading stop-losses. A daily close below $97 would confirm the breakdown and establish a new lower high in the developing downtrend structure.
Given the mature ADX reading and complete breakdown of moving average support, the most probable near-term path sees OKB consolidating between $90-105 while the overbought conditions from Q3 fully reset. Exchange tokens often require extended basing periods following parabolic advances, suggesting patience remains the optimal strategy for both bulls and bears at current levels.