OKB Surges 99% in Six Months Despite December Weakness as Exchange Tokens Dominate
Exchange Token Momentum Shifts
- OKB surged 99.33% over the past six months despite an 8.56% retracement in December.
- The launch of OKX perpetual contracts has strengthened institutional legitimacy of the OKX ecosystem.
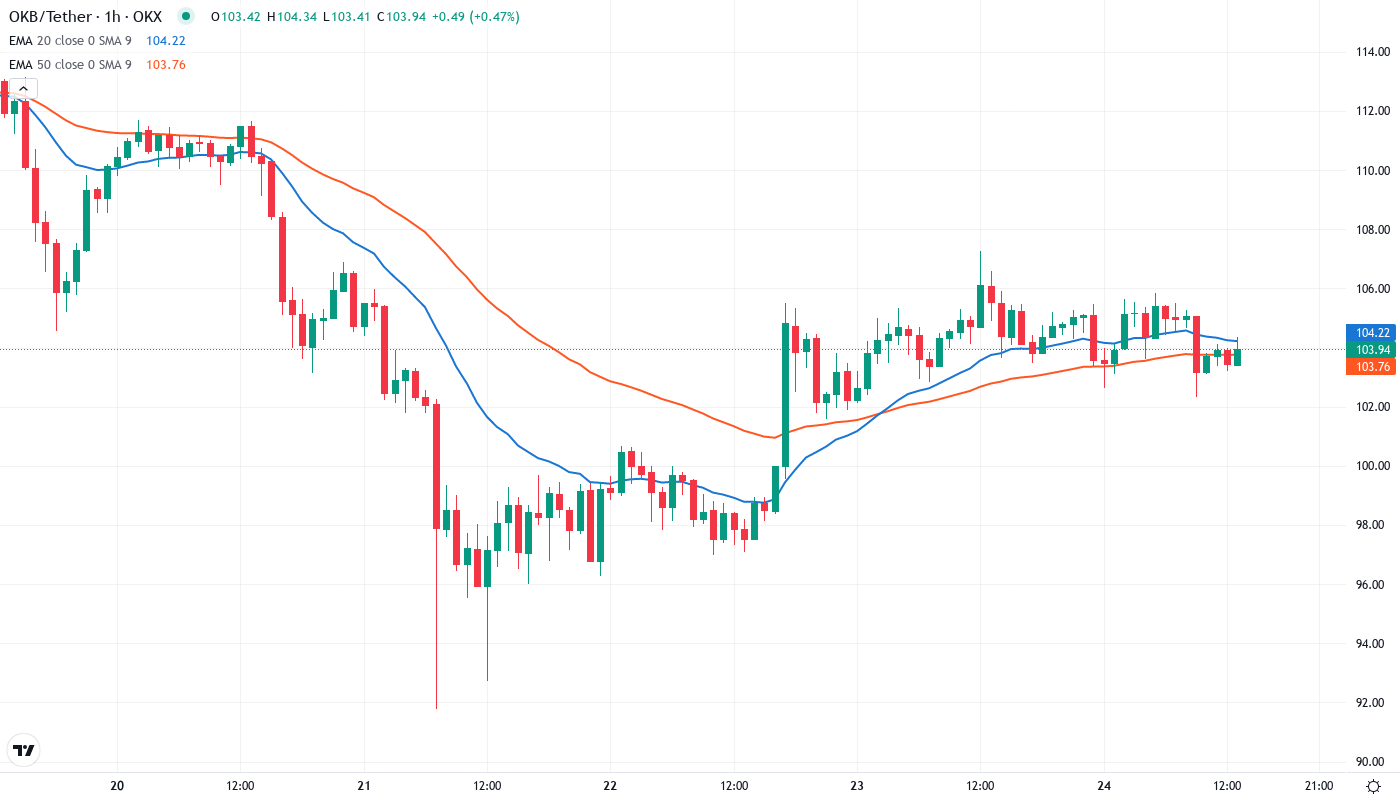
- OKB is trading at $104.13, reflecting its growing capabilities as a store of value.
Despite a pullback in late December 2025, the OKB exchange token has been one of the best performers in the cryptocurrency market over the past six months. The long-anticipated OKX perpetual contract launch has further strengthened the growing institutional legitimacy of the OKX ecosystem and exchange token space more broadly.
Over the past six months, OKB has jumped 99.33% higher from June low, even after December’s 8.56% retracement has the token currently trading at $104.13 exchange token’s capabilities as a store of value. The past 12 months have seen price rally 103.78%, a performance that far outstrips most coins, barring a few top-performers. Most notable is how well OKB weathered the storm during October’s sharp correction, which coincided with the total market cap flirting with a USD 4 trillion valuation and exchange tokens proving to be the surprise champions of Q3, 2025. The question no doubt on traders’ lips at this stage is “Can OKB continue to outperf orm and reach this target now that OKX is about to release OKB/USDT perpetual contracts and possible unlock new streams of liquidity?
| Metric | Value |
|---|---|
| Asset | OKB (OKB) |
| Current Price | $104.13 |
| Weekly Performance | -8.56% |
| Monthly Performance | -36.70% |
| RSI (Relative Strength Index) | 30.4 |
| ADX (Average Directional Index) | 56.7 |
| MACD (MACD Level) | -12.53 |
| CCI (Commodity Channel Index, 20-period) | -96.33 |
Momentum Holds Mid-Range After December Cooldown
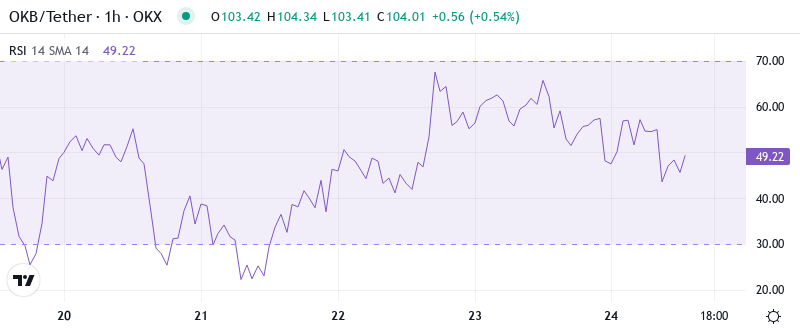
The Relative Strength Index (RSI) currently stands at 49.31 on the one-day time frame. This means momentum is in absolutely neutral state. After stepping back from overbought metrics just above 70 at the end of November, it is indicated that bulls can take a breather without getting a surrender signal – it is simply a neat rollback, not a full scale turn of the tide. The way the oscillator is moving is similar to the previous occasion in September, when the RSI is dropping to similar levels prior to the start of the subsequent 40% rally over the next half-dozen weeks.
Therefore, a consolidation pattern forming between $6 and $8 over the short term appears to be the most probable outcome, unless unfavorable news or events surrounding the perpetual contract trigger a major sell-off.
ADX at 56.65 Confirms Strong Trending Conditions Despite Pullback
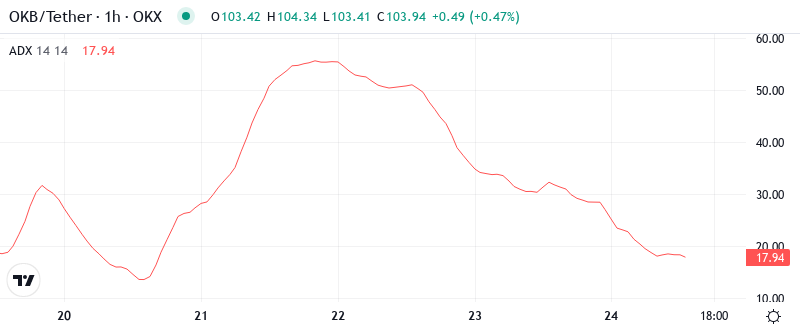
When judging trend strength, the direction of the ADX line is crucial. Values rising and declining, respectively, indicate a strengthening or weakening trend. The ADX line has been rising since mid-October, and despite being the highest reading in over a year, it continues to climb. This is a textbook example of a very strong low-margin trend, resulting in some mildly overbought price action. However, there aren’t enough warning signs to abandon the ship.
In other words, when a strong trend is in play, the ADX can signal to stay in as trends persist while a significant pullback and a crossover of the DM- and DM+ could warn of an actual reversal. The ADX has almost hit 50 too, a level which often suggests a trend is becoming extremely strong and potentially overextended. This metric is a solid 35.
50-Day EMA at $125.38 Becomes Key Resistance After December Breakdown
Looking ahead, the 10-week at $113.94 will enter consideration as a roadblock, with the looming 20-week EMA now upwardly sloped around $122 posing the most imposing short-term hurdle for bulls to clear. If they manage to surpass that, the 50-week at $137.35 should be viewed as a dangerous obstacle.
What is worth mentioning is the compression that is taking place between the 100-day EMA of $137.05 and the 200-day EMA of $139.31, the last time these averages had been so close to each other was in early 2025. This MA tends to precede explosive moves as the market starts getting coiled. The launch of the upcoming Perpetual contract may build enough volume to push back above these levels in particular if there’s an inflow of institutions driving up other exchange tokens.
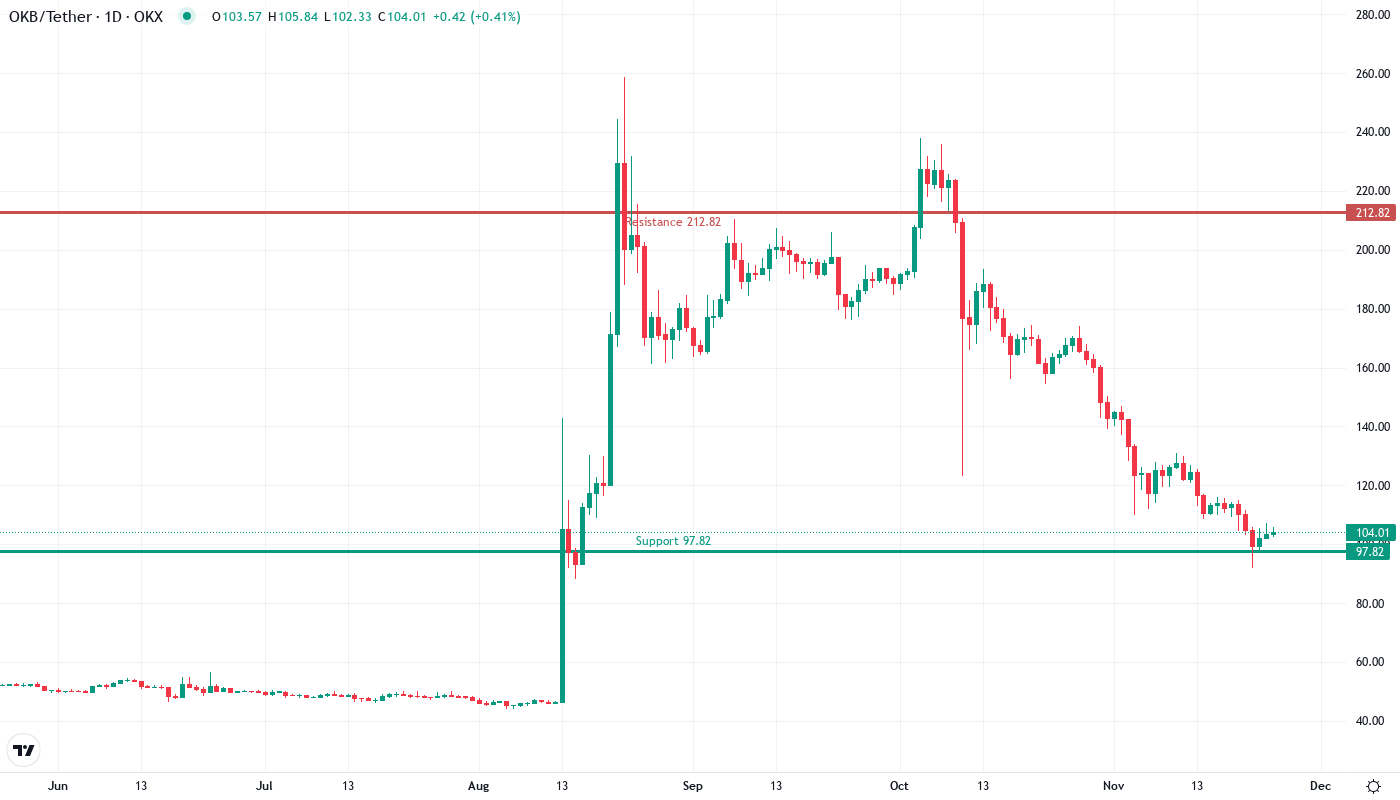
Support Architecture Builds Between $90 and $98 While Resistance Stacks Above
There is strong resistance clustered between the monthly pivot at $98.55 and the psychological $100 level that capped December’s rally. Sellers above that figure can look to the 10-day EMA at $107.89 and then to the weekly R1 pivot at $126.33, which aligns closely with the 50-day EMA to reinforce resistance.
Bulls defend different levels of support, the monthly S1 pivot at $74.43 is the most important floor. It held during December’s steepest decline, forcing rates to rebound above $90, where buyers made a strong push. This is a support base ranging between $90-$98 that proved successful on several occasions. The overall exchange token story had OKB and rivals performing massively better than Bitcoin in the third quarter of 2022.
Importantly, OKB continues to hold above support of both the 50-day and 200-day exponential moving averages. The relative strength index on the daily chart is testing overbought territory at a reading of 70; a result of the recent uptick in volume and price. It is also forming a series of higher lows and higher highs – indicative of strong, bullish momentum. For an entry, buyers would like to see consolidation around this level.
Bulls Need Decisive Close Above $115 to Reignite Six-Month Uptrend
If OKB reclaims the $115 neckline with volume, it opens up the path to $140 for the longer-term moving averages. The launch of the perpetual contract provides the fundamental catalyst the bulls need. It could lead to an influx of liquidity driving price through overhead resistance. A weekly close above $126 would confirm the resumption of the trend and validate the monthly high as the next target at $173.99.
If the dip buyers rescue price from the sub-$90 territories and we see a decisive rally above the $120 resistance, then all-time highs are expected to follow shortly. Using the 161.8% extension of the October rally as the next target implies a price of $193. This level is marginally below the 200% extension at $212 and near the 2021 highs at $197.80.
Based on the technical setup and the upcoming perpetual contract catalyst, the most likely short-term trajectory has OKB consolidating in the $98-$115 range before making another push at the neckline resistance. Neutral RSI, extreme ADX readings and pinched moving averages imply this range consolidation won’t be for long – look for a resolution in the next two weeks as the new perpetual contract institutional inflows come into play.