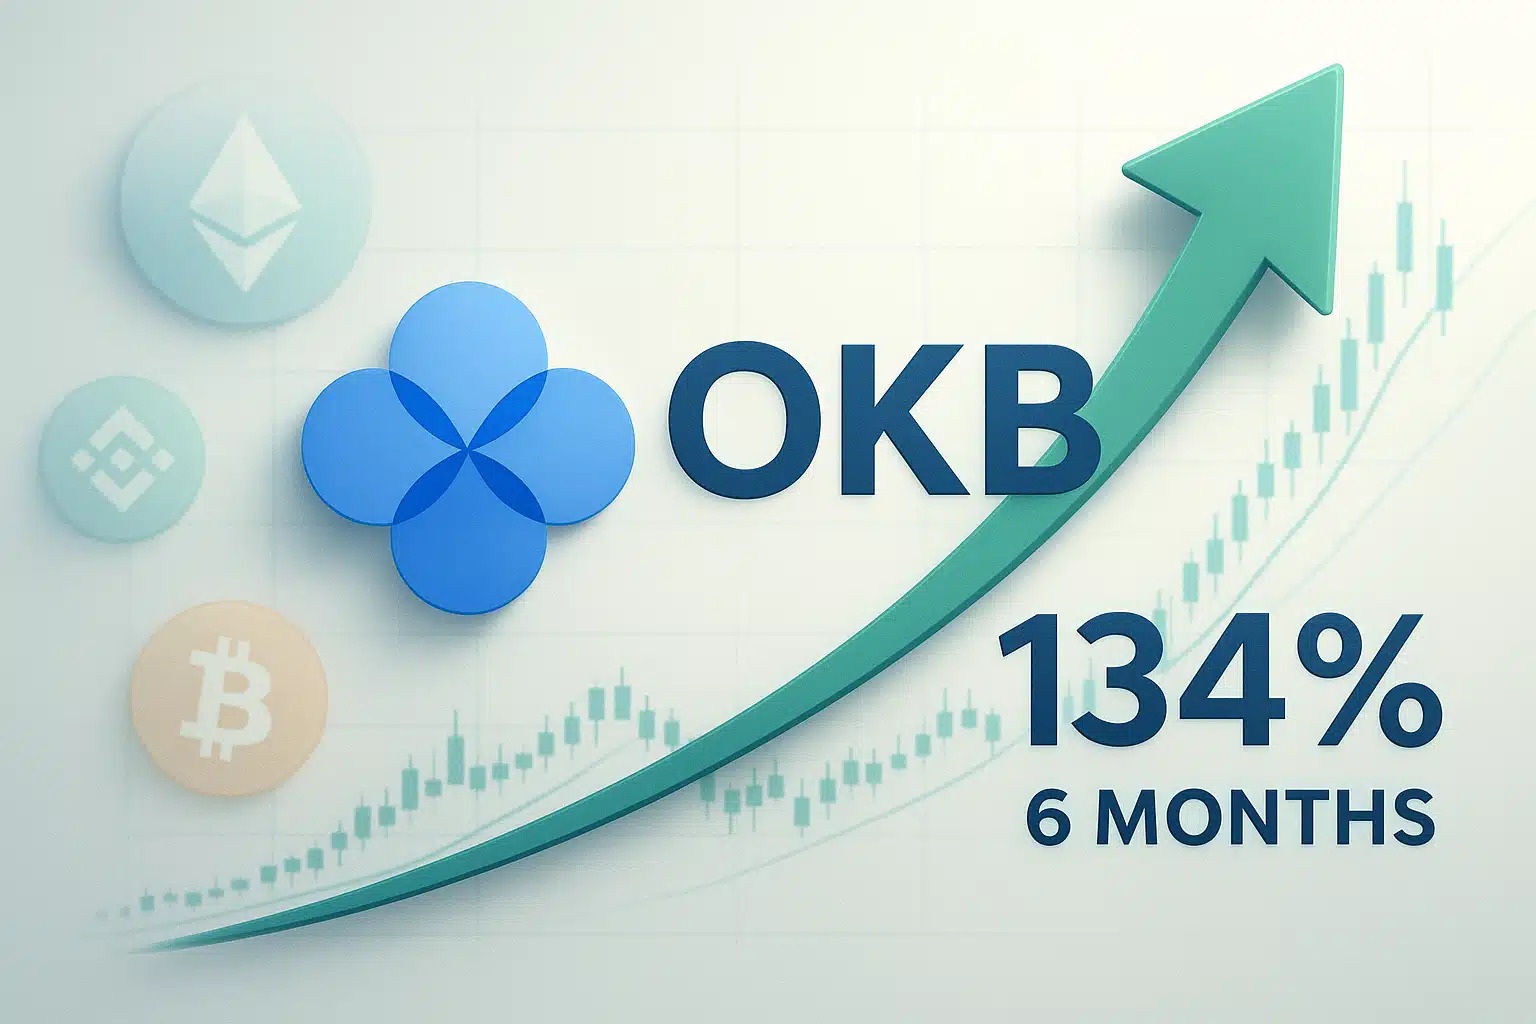
OKB Surges 134% in Six Months as Exchange Tokens Outperform Bitcoin
Market Structure Shifts Higher
- Despite recently pulling back, OKB has reached $124.79 with a whopping 134% gains in six months
- RSI, remains in neutral territory after the reaching the overbought level above 80
- Perpetual contracts for the exchange token sector is now available as the launching of new ones is bringing this sector to the boil
During the last six months, OKB doubled its phenomenal performance in the base tokens category and increased its rate by 134% to $124.79, despite a quick decline of 34% from the $184 peak in December. In the aftermath of the crypto market cap nearing $4 trillion, the exchange tokens have seen the momentum come up even stronger, and specifically OKB was able to surpass Bitcoin in the recovery period of Q3. Traders’ main question is: can OKB defend the psychological $100 level and resume its uptrend or will profit-taking pressure drive further retracement toward the 50-week EMA at $82?
| Metric | Value |
|---|---|
| Asset | OKB (OKB) |
| Current Price | $124.79 |
| Weekly Performance | 0.45% |
| Monthly Performance | -33.77% |
| RSI (Relative Strength Index) | 33.4 |
| ADX (Average Directional Index) | 49.0 |
| MACD (MACD Level) | -13.08 |
| CCI (Commodity Channel Index, 20-period) | -62.30 |
RSI Drops to 45.5 After December’s Extreme Overbought Reading
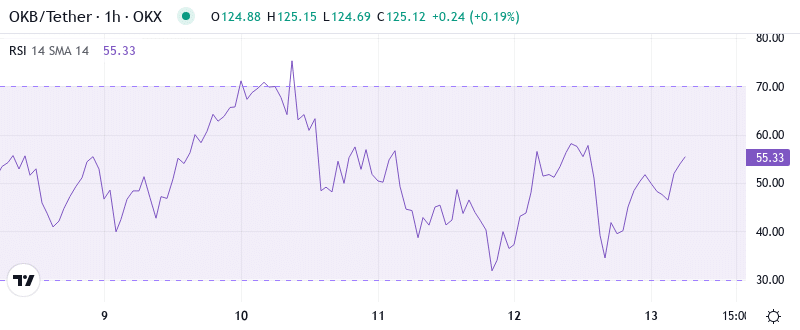
The traders, monitoring the oscillator, are reading it at 45.53 which indicates a healthy reset from the extreme level of overbought in the previous month where RSI rose above 83 – a level that is historically associated with major top formations. This deceleration has restored the momentum to a neutral state where buyers and sellers can function without the stretched conditions that troubled the price action during late December.
Basically, in the currency market and all over the world, the RSI appeared to be more similar to the prices that have been fluctuating around the top and bottom range for the first quarter of the year (March) and after the summer season (August). In both cases, the corrections of these periods caused 20-30% drops in the asset price which was then followed by up-trends that were substantial. The implication of the swinging traders is that the balance of the RSI is an invitation to utilize the trade for making money. This reading means that especially with the soon-to-come launch of OKB/USDT perpetual contracts on OKX, the liquidity and trading interest will be raised which will be added by these factors.
ADX at 48.9 Confirms Strong Trending Conditions Despite Pullback

The ADX entry at 48.95 implies that the trend is still unbelievably strong even after the recent correction – readings above 40 usually indicate the mature trends coming to exhaustion. In essence, the scenario is that we are witnessing the strength of conviction behind both the half-year rally and the ongoing pullback, therefore, I do not think this is just taking profit but it is rather a larger change in the market’s arrangement.
Those who are interested in following the trend should comprehend that the simultaneous presence of ADX readings around 50 with major inflection points is a common occurrence where trends go either to the extreme by introducing blow-off tops or change direction very quickly. Hence, traders who work on daily cycles should gear up for the high volatility situation as the outperformance of the exchange token sector brings in both the momentum chasers and profit-takers at the top levels.
50-Day EMA at $153 Becomes First Major Resistance After Support Break
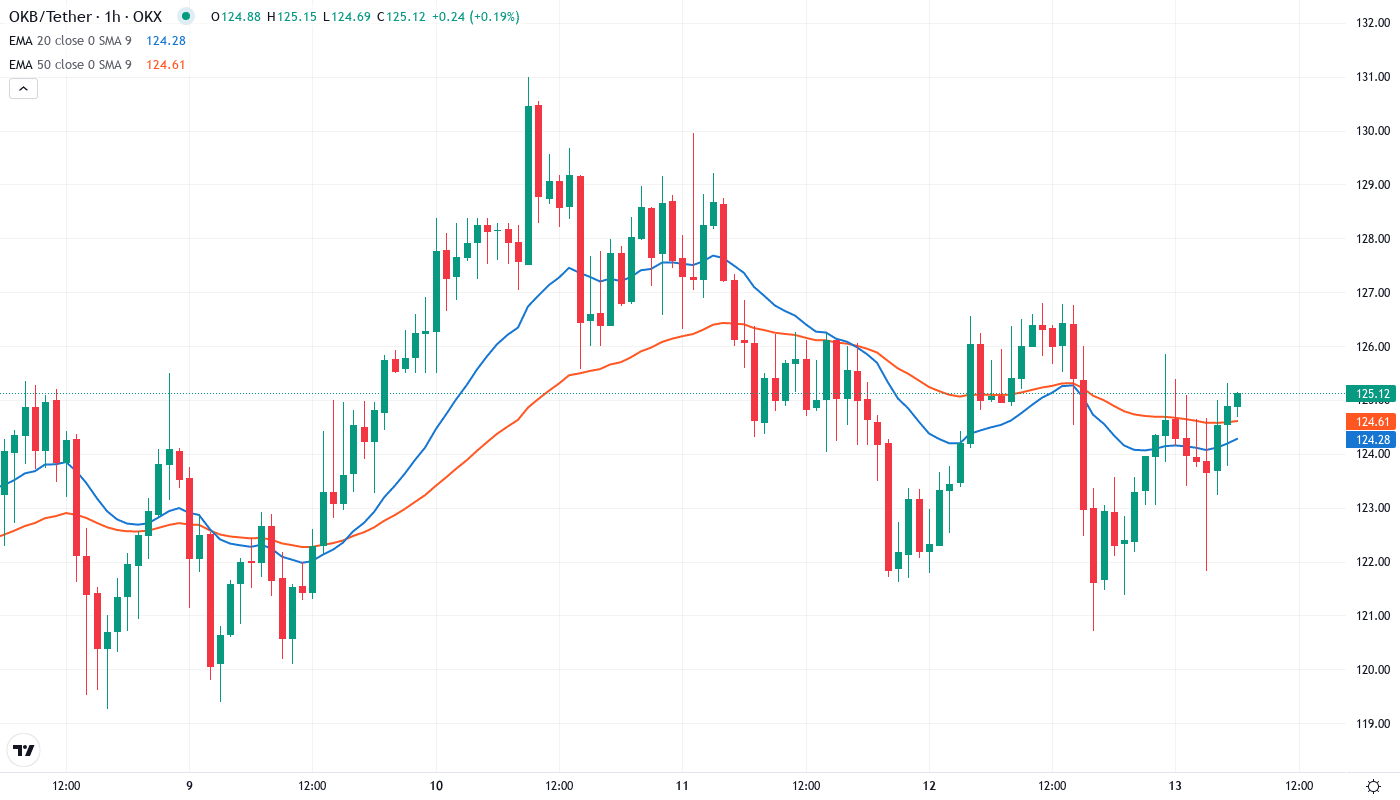
Technically speaking, the bearish inclination is evident on the price action. Currently, the price of OKB has moved below both the 10-day ($127.82) and 20-day ($137.40) EMAs, thus, ending their recovery attempts in a subjective manner. The 50-day EMA is the one we watch for. At $153.73, it has now turned into overhead resistance, while it was a good support line during the November rally.
At $98.15, the 100-week EMA is a distant dot of hope for the bulls, which is closely aligned with the psychological $100 level along with it providing a confluence zone for potential reversal.
Bulls must stand their ground at this 2024 early resistance turning into support, or else bears push prices all the way down to the 200-week EMA at $73.65.
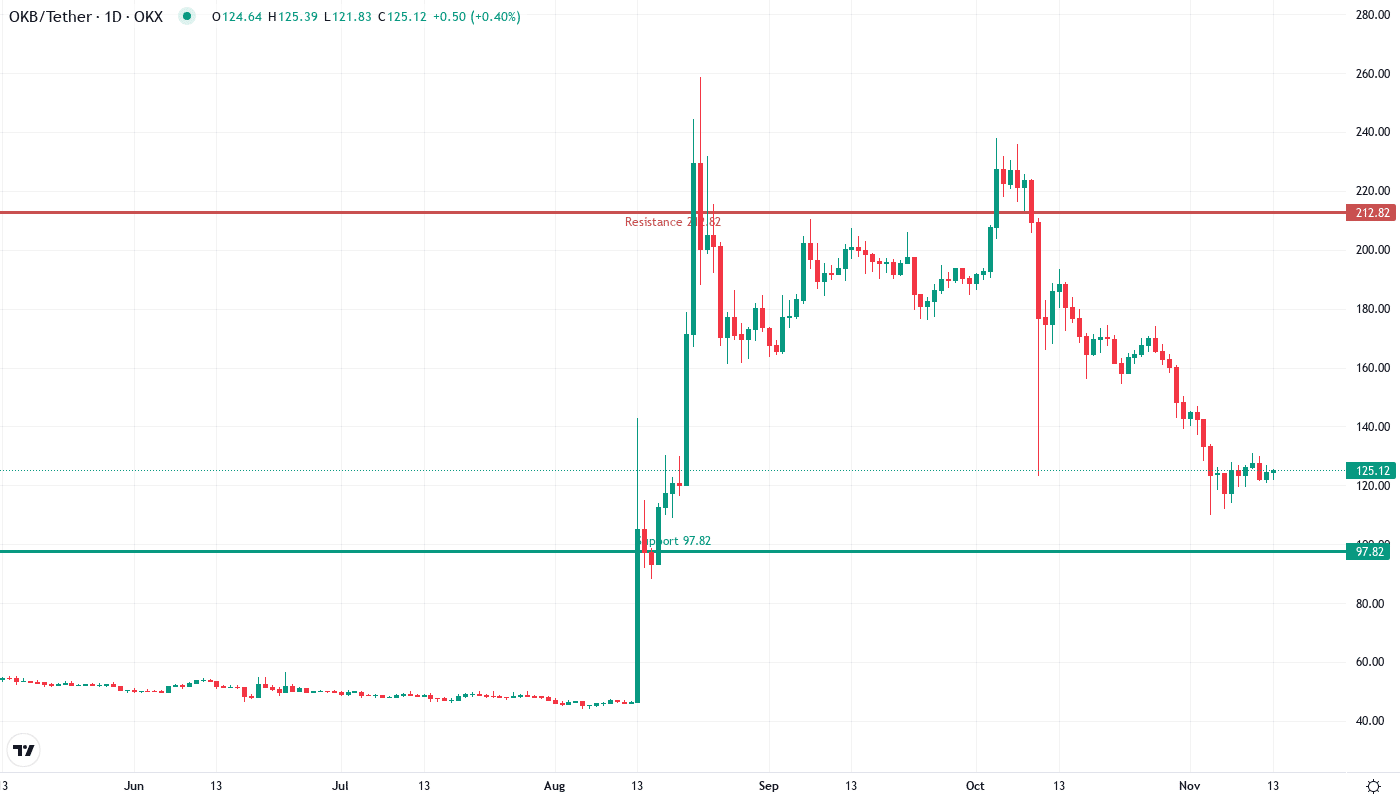
Support Stacks Between $98-$110 While Resistance Clusters at $142-$154
Resistance layers have been so powerful that they have practically stopped all attempts for recovery, with the immediate ceiling of $142.14 which is both the monthly pivot and the zone where multiple failed bounces took place. On top of that, sellers have constructed stronghold positions across the 50-day EMA at $153.73, thus forming a resistance cluster that concurs with December’s breakdown level where the early buyers are likely to be in the loss position.
The seen-support becomes more stable as a result of the combination of the technical and the psychological levels between $98-$110. The weekly pivot at $98.54 is almost touching the 100-week EMA at $98.15, while the monthly S1 at $97.82 adds another layer of potential buying interest. This trifold collocation is around the-$100 psychlogical level, which attracts a lot of volume on the previous tests.
According to the pattern compression of the market structure, it seems to take place between these main areas, with the decline in trading volume surfaces the traders are anticipating for the next catalyst. The introduction of the perpetual contract which is on the schedule for today could be the best move for that spark to ignite. Nonetheless, the present trading scenario is in favor of the range trading environment till $110 support line is either broken down or $142 resistance line is rejected.
Bulls Need Convincing Close Above $142 to Revive Uptrend
If the monthly pivot level of $142.14 is reclaimed by OKB, it will be able to do it with high conviction and remain above that mark with a daily close. The next major target for the bulls would then be the 50-day EMA at $153.73. The additional fundaments for such growth are the perpetual contrac
t launch and the exchange token outperformance which offer the directional wind. If the entire crypto ecosystem proves to be stable, these two will be the main drivers for the recovery.
</p>
The bears would take over with a significant price per volume decline dipping through the lower-bound of the $98-$100 support confluence, thus, trapping those who recently bought it due to the dip into the position and also would possibly execute the target stops toward the $73.65 200-week EMA. A drop of such an extent would mean the complete reversal of the Q4 movement, thus, the medium-term bearish market structure will get established more definitely, especially if Bitcoin does not succeed in standing on its support.
As per the very high ADX reading and the neutral RSI setup, the most likely near-term scenario is that OKB will consolidate in a range of $110 to $142 while absorbing the huge six-month gains. This sideways movement would permit the moving averages to flatten and the momentum indicators to reset before the next trending move occurs.