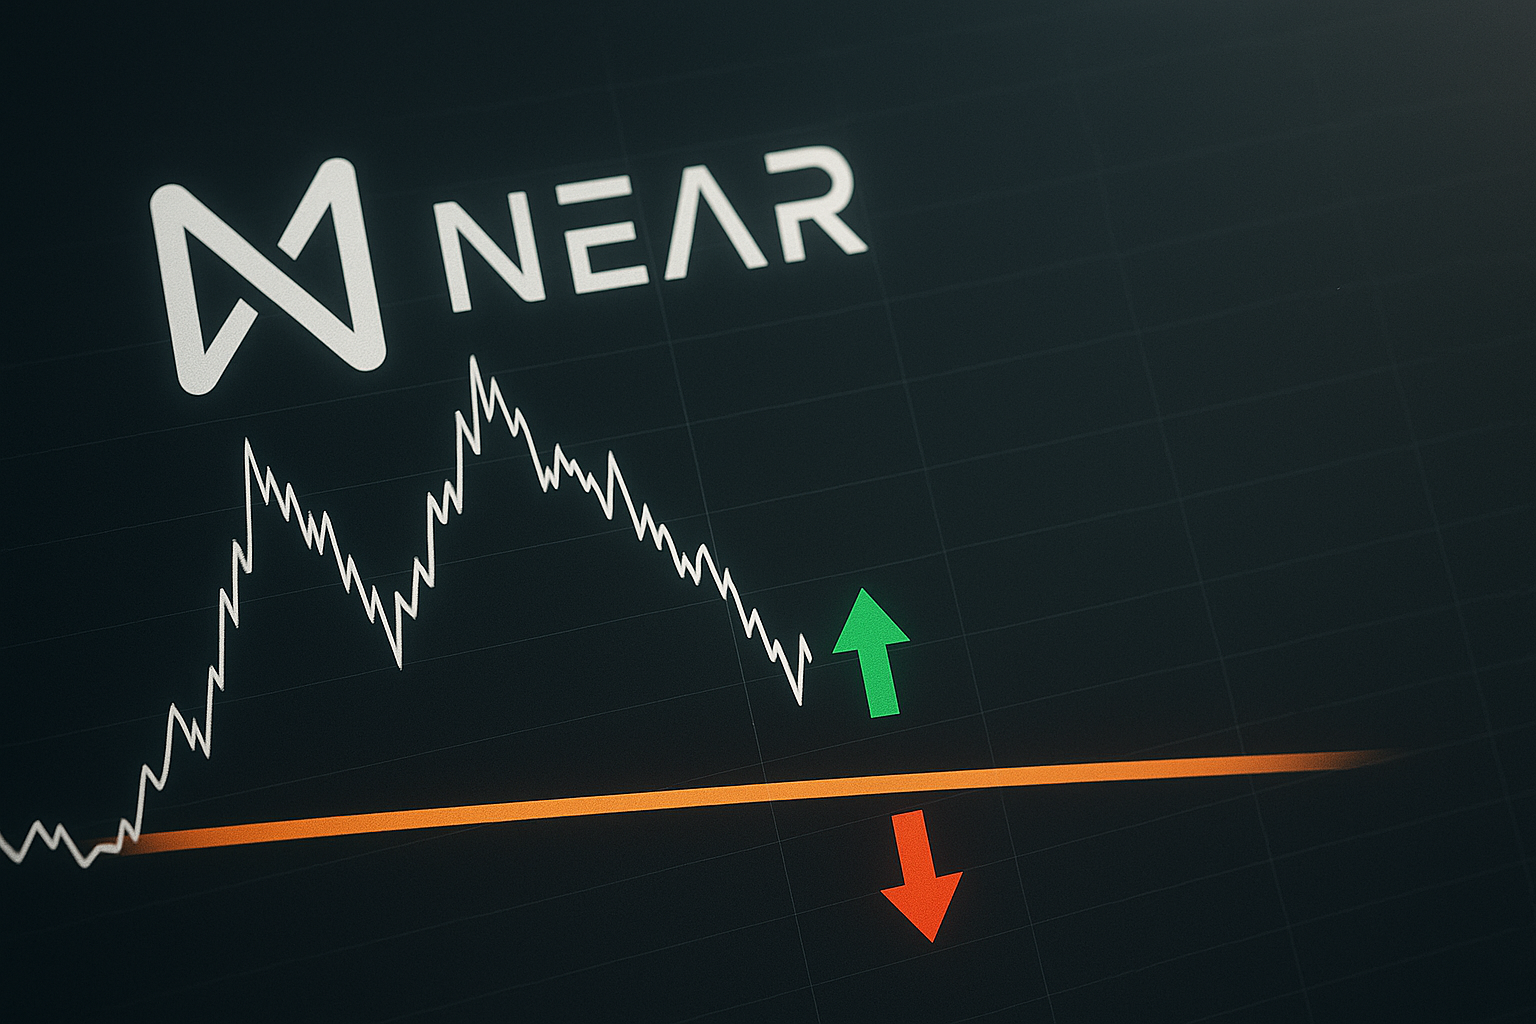
NEAR Protocol Tests Make-or-Break Support as Van de Poppe Calls Cycle Bottom
Market Structure Shifts Lower
- Price slumps 22.5% monthly despite $5B Intents milestone achievement
- Van de Poppe’s cycle bottom call meets reality of $1.80 support battle
- Technical indicators flash oversold but momentum exhaustion remains unclear
NEAR Protocol’s price action tells a sobering story this week, shedding 17.4% to trade at $1.89 as the critical $1.80 support zone comes under sustained pressure. The monthly performance paints an even grimmer picture with a 22.5% decline, erasing gains despite the protocol’s Intents system surpassing $5 billion in all-time volume – a milestone that would typically fuel bullish sentiment. The main question for traders is: can Van de Poppe’s cycle bottom call hold water when technical structure continues deteriorating?
| Metric | Value |
|---|---|
| Asset | NEAR PROTOCOL (NEAR) |
| Current Price | $1.89 |
| Weekly Performance | 1.17% |
| Monthly Performance | -17.36% |
| RSI (Relative Strength Index) | 38.6 |
| ADX (Average Directional Index) | 19.5 |
| MACD (MACD Level) | -0.14 |
| CCI (Commodity Channel Index, 20-period) | -75.07 |
RSI at 38.6 Matches Historical Capitulation Zones
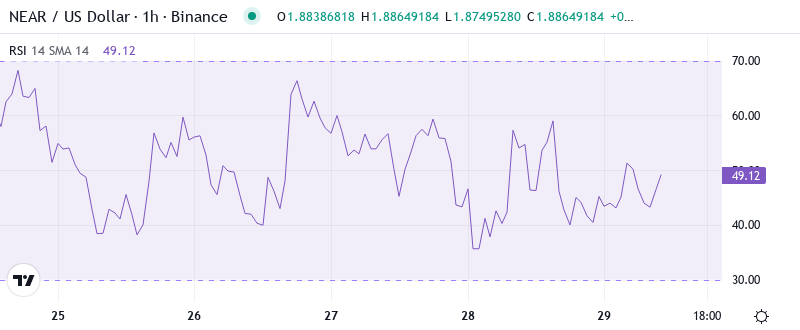
Reading the oscillator at 38.6 on the daily timeframe reveals NEAR has entered oversold territory for the first time since the August washout. This isn’t just another dip – we’re seeing momentum exhaustion levels that historically marked significant bottoms in NEAR’s price action. Van de Poppe’s bullish bet gains some technical credence here, as similar RSI configurations in September 2023 preceded a 180% surge over the following quarter.
What’s revealing is how RSI behaved during the descent. The indicator didn’t just gradually decline but plunged from 65 to current levels in under three weeks, signaling genuine capitulation rather than orderly profit-taking. So for swing traders hunting reversal setups, this momentum reset creates the first legitimate oversold bounce opportunity since summer, though catching this falling knife requires precise risk management given the $1.80 support remains under siege.
Trend Strength Fades as ADX Drops to 19.5
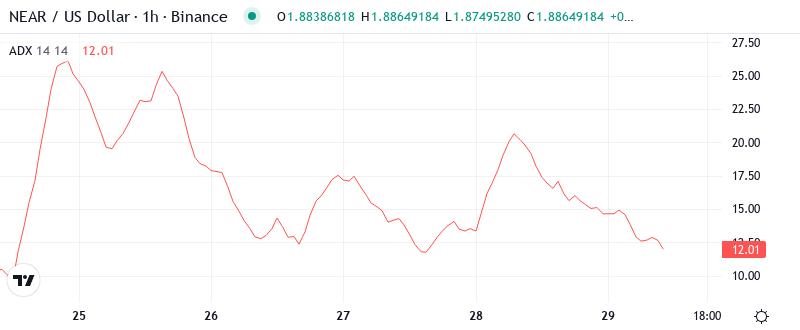
At the level of 19.5, the ADX entry indicates that NEAR has shifted from trending to ranging conditions – basically a momentum vacuum where neither bulls nor bears command decisive control. This reading sits well below the 25 threshold that typically marks trending markets, suggesting the recent selloff has exhausted itself into sideways chop rather than continuation.
To clarify, the ADX is indicating that we are switching from impulsive selling to a consolidation phase where support and resistance levels gain importance. Therefore, range traders should suit their strategies to these boundary conditions, focusing on the $1.80-$2.10 zone until ADX climbs back above 25. The $5 billion Intents milestone provides fundamental backing, but technical momentum needs rebuilding before any sustainable recovery attempt.
20-Day EMA at $2.08 Caps Recovery Attempts
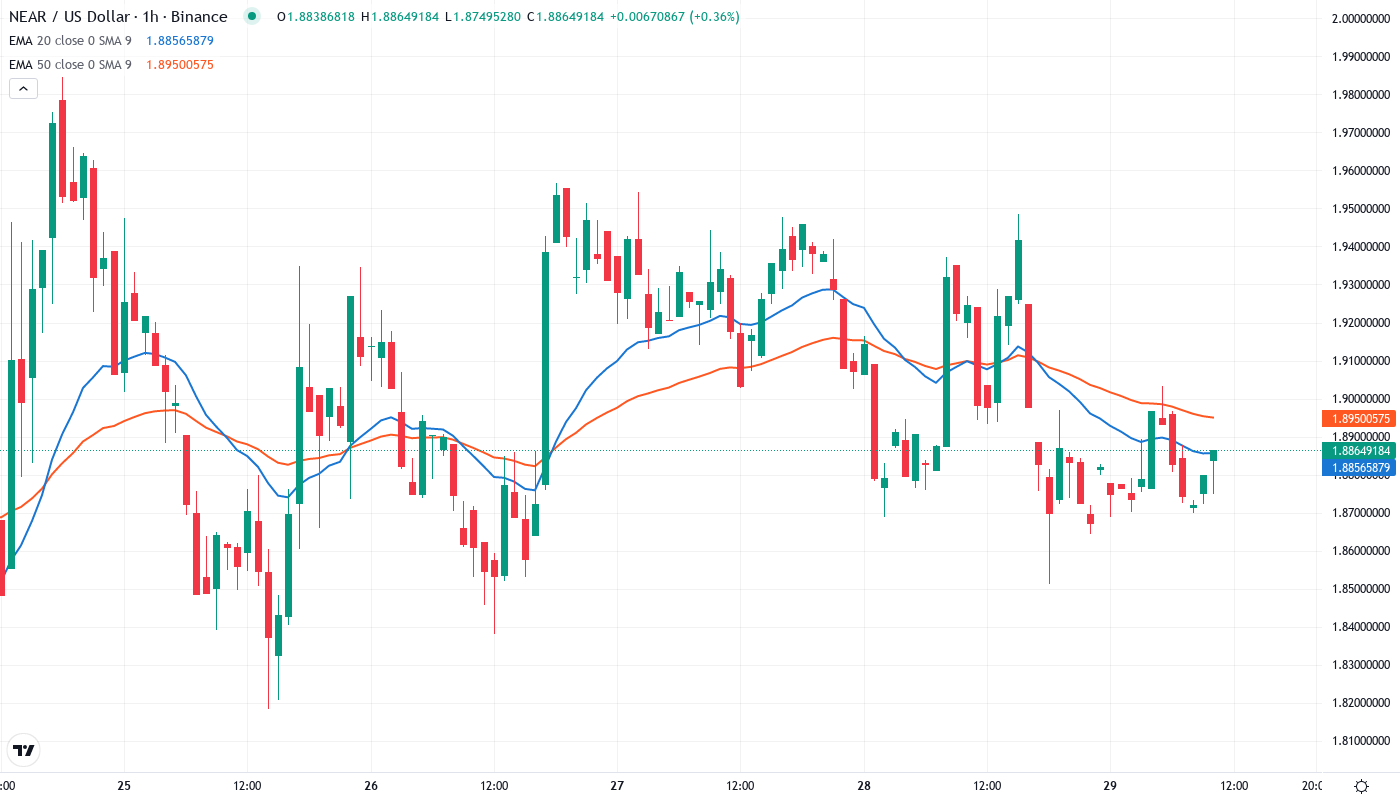
Price action through the EMA ribbons reveals a bearish structure that’s been building since December. NEAR currently trades below all major moving averages – the 10-day ($1.96), 20-day ($2.08), and crucially the 50-day EMA at $2.26. Each of these levels transformed from support to resistance during the recent breakdown, creating a stacked barrier for any recovery attempt.
Most telling is the compression between the 10 and 20-day EMAs, now separated by just 12 cents compared to 35 cents a month ago. This tightening suggests a resolution approaches – either a decisive reclaim of the $2.08 level that reopens upside, or continued pressure toward Van de Poppe’s anticipated bottom zone. The 50-day EMA at $2.26 now represents the line in sand between correction and renewed downtrend.
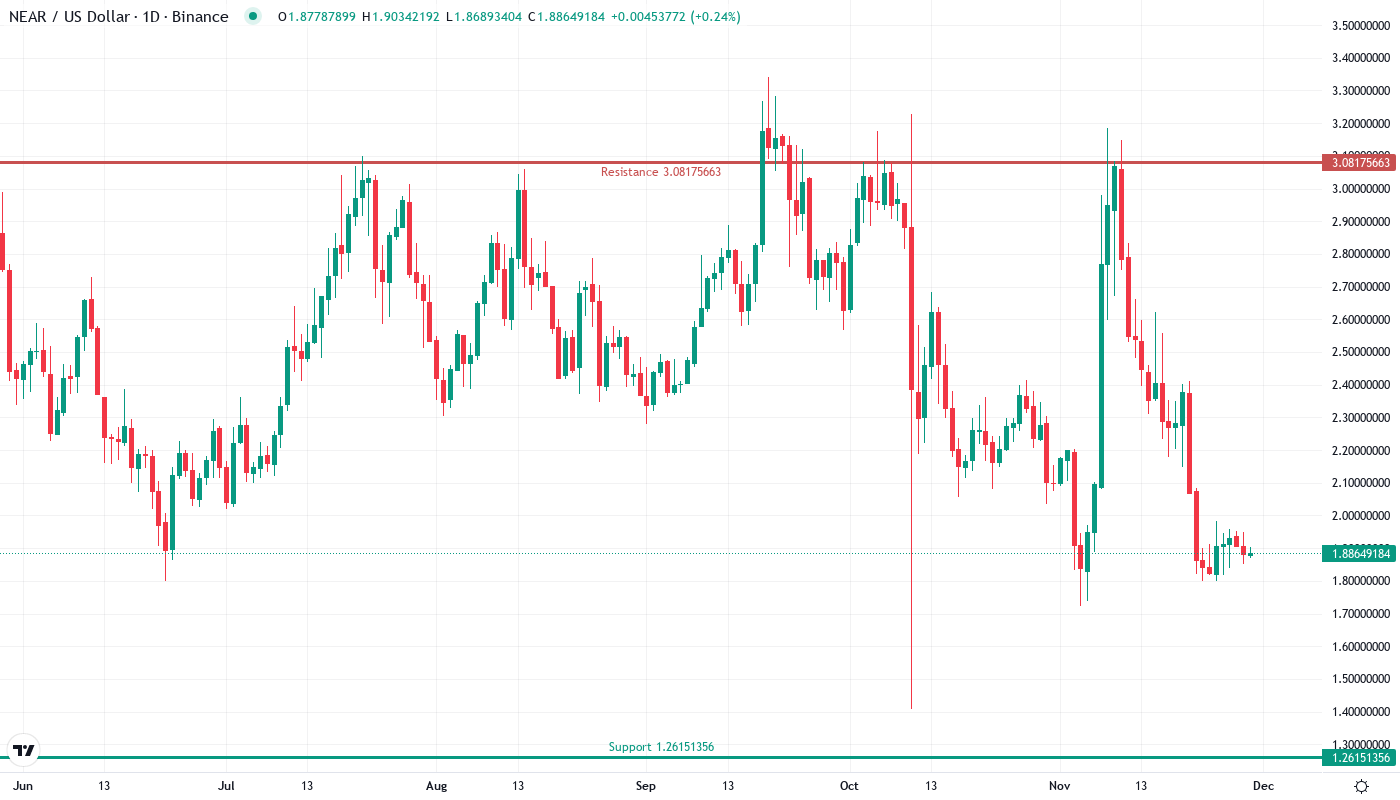
$1.80 Support Faces Fourth Test as Resistance Stacks Above
Sellers have fortified resistance between $2.08 and $2.26, where the 20 and 50-day EMAs converge with December’s breakdown point. This zone rejected two recovery attempts last week despite the positive Intents volume news, confirming bears maintain tactical control. The psychological $2.00 level adds another layer to this resistance cluster.
On the support side, the much-discussed $1.80 level faces its fourth test since November, with each bounce showing diminishing strength. Van de Poppe’s cycle bottom thesis essentially rests on this level holding – a break below would expose the $1.50-$1.60 zone last visited during the summer capitulation. Volume patterns show accumulation attempts near $1.80, but conviction remains questionable.
The structure reveals a compressed triangle pattern with $1.80 as the base and $2.10 as resistance. This configuration typically resolves with a 20-25% move in either direction, putting targets at $2.35 on a breakout or $1.45 on a breakdown. Given the oversold conditions and fundamental progress, the setup favors patient accumulation over aggressive shorting, though bulls need to defend $1.80 with conviction.
Bulls Need Decisive Close Above $2.08 to Shift Momentum
Should NEAR reclaim the 20-day EMA at $2.08 with volume, the technical picture shifts dramatically. Such a move would trap late shorts while confirming Van de Poppe’s bottom call, opening a path toward $2.26 and potentially $2.50 if the Intents momentum translates to price appreciation. Bulls require this level on a daily close, not just an intraday spike.
The bearish scenario triggers if $1.80 support crumbles under sustained pressure. This would invalidate the accumulation thesis and likely flush positions toward $1.50 or lower, creating the capitulation event that often marks cycle bottoms. Given current momentum exhaustion, this breakdown would need significant volume to sustain – weak selling might actually confirm the bottom.
Given oversold RSI, non-trending ADX conditions, and repeated defense of $1.80 support despite negative sentiment, the most probable near-term outcome sees NEAR consolidating between $1.80-$2.10 while digesting the Intents milestone news. This ranging action would allow technical indicators to reset before the next directional move, with Van de Poppe’s conviction potentially attracting value hunters at these levels.