NEAR Protocol Tests Critical Support as Network Upgrades Trigger Exchange Suspensions
Market Structure Shifts Lower
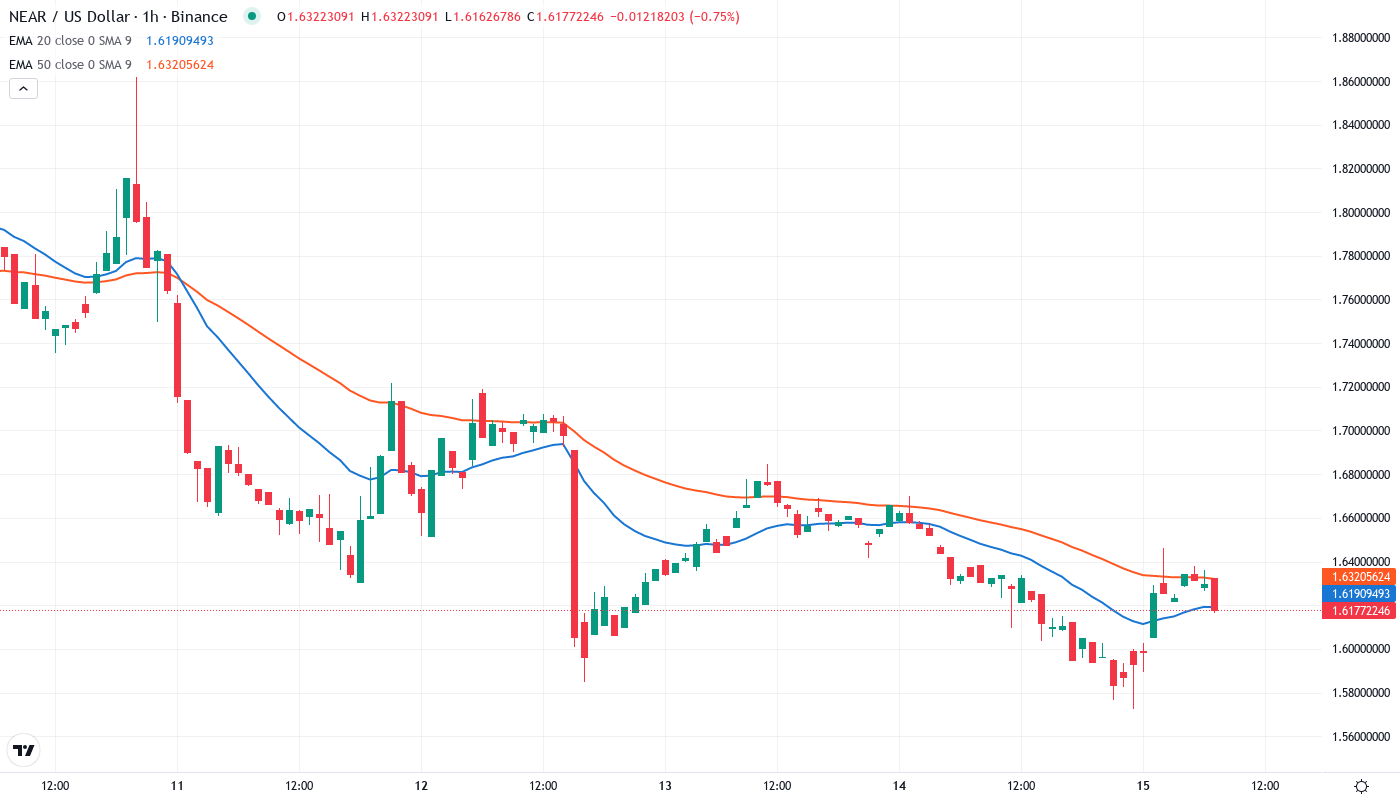
- The price movement indicates a breakdown below all significant moving averages, with trading currently at $1.62.
- The temporary liquidity vacuum occurred due to network upgrade suspensions on Upbit and Bithumb.
- Following a 38% collapse over the month, bulls are now defending the six-month support zone.
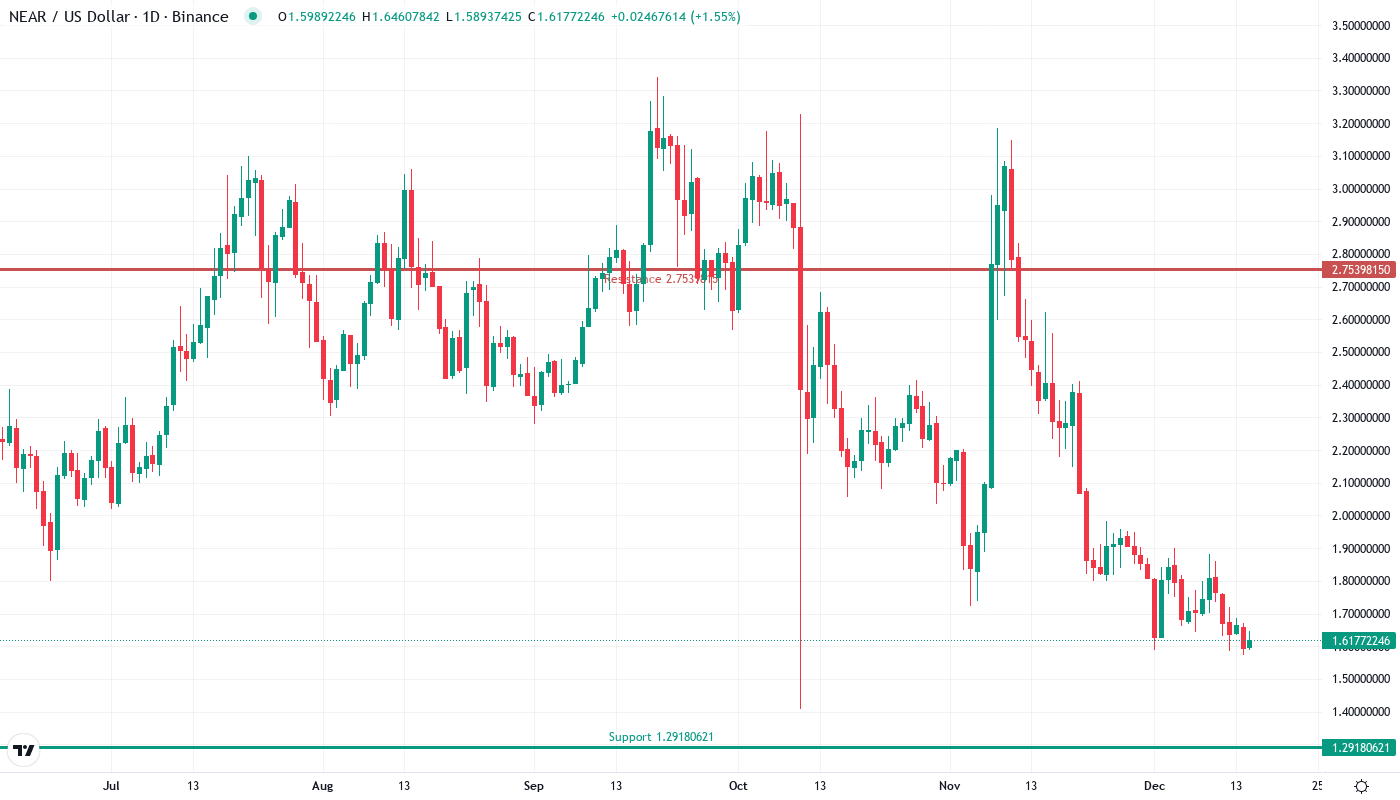
This week, NEAR Protocol breached multiple support tiers while plunging 31.5% over the past 30 days to about $1.62 on upsetting news that it’s taking a sizeable bite out of its market cap. Upbit and Bithumb sent the suffering altcoin into a tailspin after tweeting that NEAR trading would be unavailable for a few days due to network maintenance. This caused NEAR’s already nervous market to sell off faster and forced late longs to dump their positions at painful losses. The token bled across five major moving averages within a hair of a dreaded “death cross” while recording oversold readings deep into the 30s.
| Metric | Value |
|---|---|
| Asset | NEAR PROTOCOL (NEAR) |
| Current Price | $1.62 |
| Weekly Performance | -4.95% |
| Monthly Performance | -31.49% |
| RSI (Relative Strength Index) | 37.4 |
| ADX (Average Directional Index) | 26.6 |
| MACD (MACD Level) | -0.12 |
| CCI (Commodity Channel Index, 20-period) | -116.73 |
Momentum Exhaustion Signals Capitulation Phase Complete
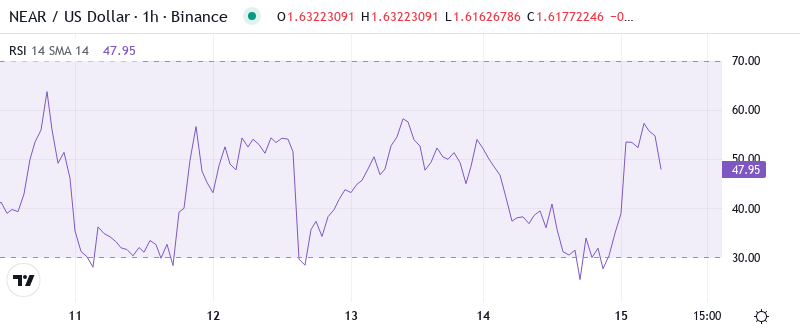
The Relative Strength Index (RSI) is an indicator often used in trading to analyze the velocity and magnitude of price movements. It is frequently used to identify overbought or oversold conditions in a market. The RSI is a normalized oscillator ranging from 0 to 100. A stock is deemed to be overbought once the RSI approaches the 70 level, indicating that it may be getting overvalued and is a good candidate for a pullback. Conversely, if the RSI approaches 30, it is an indication that the stock may be getting oversold and is a likely candidate for a rally.
Past instances when the five-day RSI on XRP is this low help set expectations for what performance might look like moving forward. Three other occurrences similar to the current print took place in September 2018, and each time, Ripple rallied between 26 and 63% higher. Returning to historical data, in fact, a buy and hold strategy based on purchasing XRP each time the five-day RSI slips below 20 and then maintaining that position would have resulted in significant gains.
ADX at 26.59 Confirms Trend Acceleration From Sideways Chop
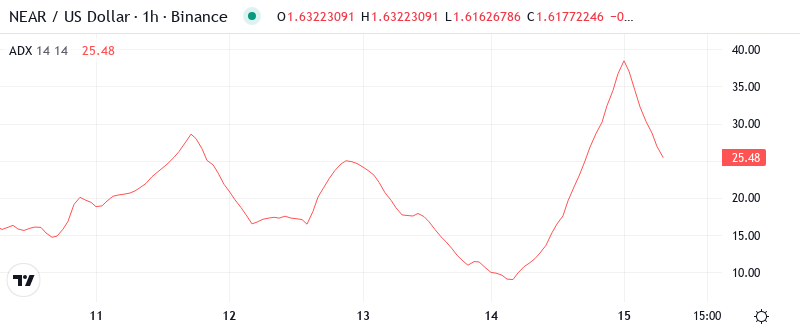
Observing the strength of the trend, the ADX moved from sub-20 readings to 26.59, which indicated a transition from conditions associated with a range to those that characterize a trending market. More importantly, this surge above 25 lets us know that sellers got serious on the breakdown and turned what initially looked like profit-taking to the downside into a real trend. The +DI/-DI spread supports bear control as dominant selling pressure overwhelms buying interest.
Simply put, the ADX suggests we transitioned from a choppy $2.00-2.50 range throughout November to a directional downside move. As a day trader, this means you adjust your approach to the current trend environment and rather than buying dips with an expectation of range to continue, you look to sell rallies into resistance.
Price Trapped Below Entire EMA Ribbon Since Breaking $2.00
Looking ahead to any relief rally, the first resistance test emerges at the $1.30 price mark. The current EMA alignment that is bearish is similar to what we saw in June just before the freefall to yearly lows. The 20-day EMA at $1.77 particularly is now immediate resistance bulls would have to take this out before even considering pressure on the psychological barrier at $2.00. In the absence of that, the moving average alignment supports further downside, especially considering the low liquidity on the exchanges to support any buying interest during the network upgrade.
Support Architecture Crumbles as $1.62 Becomes Last Defense
There is strong resistance between the 20-day EMA at $1.77 and the monthly pivot at $1.29. The 20-day and 30-day EMAs cluster at $1.77 and $1.86 and are immediate overhead resistance levels, with the next resistance being the 50-day EMA at $1.99. The psychological $2 level joins the 50-day EMA as another major barrier. The decline created the suspension news, and there is less buying liquidity to counterbalance a rebound.
Currently, the bulls are trying to defend the $1.62 level, which is the only support zone left after the cascading of every other area in December. This held NEAR six times from June to October, which is the most frequently defended floor of 2024. The weekly low of $1.57 and the price provide a final backstop, but if that level breaks, the floodgates are wide open to the yearly low of around $1.29.
The market structure is in rough shape—NEAR dropped 38.5% from the December high without putting in any notable areas of support until $1.62. This looks more like a liquidity flush than a constructive pullback, especially considering the exchange halts exacerbated every leg down. Oversold bounces aren’t going to be enough to turn this picture around; we’ll need to see consistent buying to mend the technical damage.
Bulls Require Volume Reclaim Above $1.77 to Shift Momentum
For now, damaged goods are less attractive than established names amidst an altcoin bloodbath. Until there is confirmed stability and a solid 20-day EMA test, the potential for short-term gains via quick-flip position trades is limited. Wait for the chart and market to confirm a turn before allocating any new bids or a potential portfolio shift.
If the $1.62 level holds on a daily closing basis, the rebound could progress up to resistance at $2.25, though the lack of meaningful volume and technical indicators suggests a continued range-bound consolidation is the highest probability in the near term. A failure to clear this level will likely see the 50-day MA falling back to provide resistance on the next pullback.
Based on recent price action the path of least resistance for NEAR in the immediate term continues to be chopping between $1.57-1.77 as the current network upgrade locks in. Following full re-opening of trading on all of the most liquid exchanges, better decisions will be available but until such time low-liquidity rangey-chop is likely to remain the theme.